Hi guys,
I have been developing some tools at the indo forum. This was started in response to a request by Benny, so please pop over there and follow his trade journal if interested, and also to thank him for his great idea.
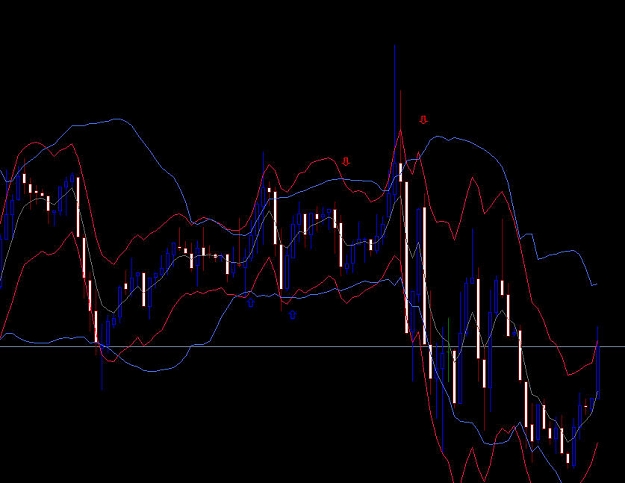
The first tool is the Trade Manager which does several things. It started as a simple partial close at the middle of the bollinger band(BB) and then sets TP to the opposite band.
I have included many extras in the funtionality and I can't go through them in depth. Please visit the thread at indo-investasi(just search under my username kennyhubbard), or post your questions here.
The EA only manages the trade.....it does not make any trades. There are also 2 scripts that work together with the EA that will make trades for you. The EA calculates trade sizes based on SL targets and will tell the script what tradesize to use in order to keep any losses within the size defined by the risk setting in the EA.
The second tool is a dashboard that allows you to monitor several currency pairs across several timeframes(customisable). It will show you when the price action(PA) breaches the 2 deviation BB as well as the PA relative to 2 moving averages(for trend determination) and also when stochastics are oversold or overbought.
Herewith a summary of the inputs and installation instructions as posted at indo.
The package consists of 5 files. In the order of the links below we have :-
Bol_TP_Dashboard_v3.mq4.............this is an indicator and goes in your expert/indicators folder.
Bol_TP_v4_Enhanced.mq4.............this is the main EA. I assume you know where this goes.
Bol_TP_Include.mqh......................this file goes in your "experts/include" folder.
Bol_TP_BUY.mq4 & Bol_TP_SELL.mq4.....these go in your "experts/scripts" folder.
The settings are as follows:-
Use_MagicNo.....if set to true, EA will generate its own unique 8 digit Magic Number for use with the script. If set to false, Magic Number that will be used is the Personal Magic number set on the next input. Use 0 if you wish to trade manually without the scrippts.
Personal_Magic....if for some reason the auto magic number is not unique enough for you, you can add from 0 to 100 to the generated magic number.
Set_SL.............enables/disables the automatic stoploss entry
SL_Buffer.........the buffer between previous bars high/low for stoploss. Set to -1 to use auto buffer determination.
SL_Bars...........number of previous bars to use for stoploss entry. Includes the current bar.
Use_Move_BE......Enable/disable move to break even;
BE_Pips.........Move SL to break even when the profit is BE_Pips. Leave at zero to use the auto BE_Pips which equals the SL_Buffer.
Use_WCA_MBE...........in the event of multiple trades on the same pair/TF, the EA can calculate the weighted cost average of your entry. Using the WCA_MBE(weighted cost entry move to break-even), the EA uses the same SL for all trades, calculated so that the sum of the profit/loss amounts to zero ie break even, rather than letting each trade reach its own independant BE point(still an option if you prefer to use that).
Offside_Close............you may recall we discussed the issue of what happens when a trade is negative and the middle MA line crosses your entry price? Well now you can elect to have the EA ignore the middle band if this presents itself, or you can still have it close half the trade(my own preference) in a sort of partial stoploss. If set to true, the half the trade will close.
Deinit_Alert..............I tend to do stupid things sometimes. Setting this to true will pop up a warning if you change the chart(pair or TF) that is currently managing a trade. It just warns you that there is a trade in progress.
Show_Comment.......if you want to hide the info in the top right corner, you can disable the display with this setting.
------------------------
TP_Use_Timer...updates the TP2 at predetermined intervals rather than every tick. EA updates each new bar by default. This setting overides new bar and sets the TP more often.
TP_Update........number of seconds interval when changing TP2
Use_TP2_Close....use market order to close at TP2 instead of server side stop. This overides all other TP2 methods.
Show_TP_Line.....enables or disables the visual TP1 line
TP_Color.............the color of the mid band TP line.
---------------------------
Use_Trail...............enables or disbles the trailing stop function
Trail_Percent.........this is the % of profit to trail by ie 50 pips profit = 25 pips trail.
Trail_Max..............stop will trail by the % you set eg 50% until the trail is equal to Trail_Max. Then the EA will trail at this fixed value. Set to -1 to use auto trail max which is the same as your SL_Buffer. Auto buffer is a function of ATR.
Use_Decay.............my little pride and joy. Ever watched the Price action hang within 1 pip of your TP and then reverse. With this option, the trailing stop is tightened as the Price approaches the TP2. The trail is equal to TP - Price, so if you are 5 pips short of TP, your trailing stop will equal 5 pips.
----------------------------
Use_Script..........this enables/disable the EA setting for the scripts. If set to false, you will get an error if you try and use the script. You must make a manual entry if this is set to false.
Risk..................this tells the script how much you want to risk. It is a % of your account balance. If you have it set to 1% and you have a $5000 account, the EA will calculate the trade size is limited to ensure that your loss at full stoploss = $50(1% of your account). So, the further you are from your stoploss at trade entry, the smaller the trade will be.
Fixed_Lots.........you can overide the risk setting and have the EA/script trade fixed lotsizes for you. In this case the EA will calculate and display your loss at full stoploss, as well as the risk level. Leave it at zero to use EA risk setting.....anything more than zero overides the risk setting.
----------------------------
Auto_SL_Ref.............this is a reference to adjust the Auto_SL_Buffer. If you feel that the buffer is too big or too small, use this parameter to adjust.
Mod_Threshold..........this is the EA's own internal stoplevel. Basically you don't want it sending orders to change things by 1 tenth of a pips, so I have set it here by default to only change any order if the modification will be more than half a pip. This can also be used as a jumping stop by entering a bigger number like 5 or 10 pips.
----------------------------
The rest of the settings are for the Bollinger bands. They should stay at default unless you have good reason to change them.
Setting up the dashboard
In order to load the currencies that you wish to monitor in the dashboard, there are several steps to take. The currencies are stored by the indicator in a csv file in the experts/files folder and is called xxx_My_DashBoard.csv where xxx represents your broker's name.
There are 2 ways to load the displayed currencies. First is to hide all currencies that you do not wish to display in your marketwatch window. Alternatively, you can simply go to the CSV file and delete the unwanted currencies. Be sure to delete the entire line in the csv file, not just the entry. If you delete the currency but leave a blank line, the dashboard will try and display that blank with unpredictable results.
In order to create the CSV file, run load the indicator onto a blank chart. You will get an alert telling you to modify the CSV file to select your currencies. If you have already sorted out your currencies in the market watch window, then ignore this message, or else go modify the CSV as mentioned.
Then reload the dashboard. Now it should display correctly. The first time you are using it, it will most probably have missing data, so you will see the following indications :-
XX - this means there is no data for that currency & timeframe.
-- This means that there is data but not enough bars.
Be sure to then download the history data.
Please refer to the thread at the indo forum for a more indepth explanation of what the number, arrows and colors mean on the dashboard.
In short, a number with color implies that the 2 dev BB has been pierced with a - being the lower band and absence of a - being the upper band. The arrows indicate the PA relative to 2 moving average with a green arrow meaning PA is above or below both moving average in the direction of the trend(trend is the direction of fast MA relative to slow MA). A red arrow would be countertrend PA and is what you are really interested in since your trade direction would be with-trend. If the arrow has no color it means the stoch is between 20 and 80, so the arrow only gets color when the stoch indicates overbought or oversold.
Have fun, ask questions and please report any bugs.
EDIT : Please note that the scripts cannot be used without the trade manager.
I have been developing some tools at the indo forum. This was started in response to a request by Benny, so please pop over there and follow his trade journal if interested, and also to thank him for his great idea.
The first tool is the Trade Manager which does several things. It started as a simple partial close at the middle of the bollinger band(BB) and then sets TP to the opposite band.
I have included many extras in the funtionality and I can't go through them in depth. Please visit the thread at indo-investasi(just search under my username kennyhubbard), or post your questions here.
The EA only manages the trade.....it does not make any trades. There are also 2 scripts that work together with the EA that will make trades for you. The EA calculates trade sizes based on SL targets and will tell the script what tradesize to use in order to keep any losses within the size defined by the risk setting in the EA.
The second tool is a dashboard that allows you to monitor several currency pairs across several timeframes(customisable). It will show you when the price action(PA) breaches the 2 deviation BB as well as the PA relative to 2 moving averages(for trend determination) and also when stochastics are oversold or overbought.
Herewith a summary of the inputs and installation instructions as posted at indo.
The package consists of 5 files. In the order of the links below we have :-
Bol_TP_Dashboard_v3.mq4.............this is an indicator and goes in your expert/indicators folder.
Bol_TP_v4_Enhanced.mq4.............this is the main EA. I assume you know where this goes.
Bol_TP_Include.mqh......................this file goes in your "experts/include" folder.
Bol_TP_BUY.mq4 & Bol_TP_SELL.mq4.....these go in your "experts/scripts" folder.
The settings are as follows:-
Use_MagicNo.....if set to true, EA will generate its own unique 8 digit Magic Number for use with the script. If set to false, Magic Number that will be used is the Personal Magic number set on the next input. Use 0 if you wish to trade manually without the scrippts.
Personal_Magic....if for some reason the auto magic number is not unique enough for you, you can add from 0 to 100 to the generated magic number.
Set_SL.............enables/disables the automatic stoploss entry
SL_Buffer.........the buffer between previous bars high/low for stoploss. Set to -1 to use auto buffer determination.
SL_Bars...........number of previous bars to use for stoploss entry. Includes the current bar.
Use_Move_BE......Enable/disable move to break even;
BE_Pips.........Move SL to break even when the profit is BE_Pips. Leave at zero to use the auto BE_Pips which equals the SL_Buffer.
Use_WCA_MBE...........in the event of multiple trades on the same pair/TF, the EA can calculate the weighted cost average of your entry. Using the WCA_MBE(weighted cost entry move to break-even), the EA uses the same SL for all trades, calculated so that the sum of the profit/loss amounts to zero ie break even, rather than letting each trade reach its own independant BE point(still an option if you prefer to use that).
Offside_Close............you may recall we discussed the issue of what happens when a trade is negative and the middle MA line crosses your entry price? Well now you can elect to have the EA ignore the middle band if this presents itself, or you can still have it close half the trade(my own preference) in a sort of partial stoploss. If set to true, the half the trade will close.
Deinit_Alert..............I tend to do stupid things sometimes. Setting this to true will pop up a warning if you change the chart(pair or TF) that is currently managing a trade. It just warns you that there is a trade in progress.
Show_Comment.......if you want to hide the info in the top right corner, you can disable the display with this setting.
------------------------
TP_Use_Timer...updates the TP2 at predetermined intervals rather than every tick. EA updates each new bar by default. This setting overides new bar and sets the TP more often.
TP_Update........number of seconds interval when changing TP2
Use_TP2_Close....use market order to close at TP2 instead of server side stop. This overides all other TP2 methods.
Show_TP_Line.....enables or disables the visual TP1 line
TP_Color.............the color of the mid band TP line.
---------------------------
Use_Trail...............enables or disbles the trailing stop function
Trail_Percent.........this is the % of profit to trail by ie 50 pips profit = 25 pips trail.
Trail_Max..............stop will trail by the % you set eg 50% until the trail is equal to Trail_Max. Then the EA will trail at this fixed value. Set to -1 to use auto trail max which is the same as your SL_Buffer. Auto buffer is a function of ATR.
Use_Decay.............my little pride and joy. Ever watched the Price action hang within 1 pip of your TP and then reverse. With this option, the trailing stop is tightened as the Price approaches the TP2. The trail is equal to TP - Price, so if you are 5 pips short of TP, your trailing stop will equal 5 pips.
----------------------------
Use_Script..........this enables/disable the EA setting for the scripts. If set to false, you will get an error if you try and use the script. You must make a manual entry if this is set to false.
Risk..................this tells the script how much you want to risk. It is a % of your account balance. If you have it set to 1% and you have a $5000 account, the EA will calculate the trade size is limited to ensure that your loss at full stoploss = $50(1% of your account). So, the further you are from your stoploss at trade entry, the smaller the trade will be.
Fixed_Lots.........you can overide the risk setting and have the EA/script trade fixed lotsizes for you. In this case the EA will calculate and display your loss at full stoploss, as well as the risk level. Leave it at zero to use EA risk setting.....anything more than zero overides the risk setting.
----------------------------
Auto_SL_Ref.............this is a reference to adjust the Auto_SL_Buffer. If you feel that the buffer is too big or too small, use this parameter to adjust.
Mod_Threshold..........this is the EA's own internal stoplevel. Basically you don't want it sending orders to change things by 1 tenth of a pips, so I have set it here by default to only change any order if the modification will be more than half a pip. This can also be used as a jumping stop by entering a bigger number like 5 or 10 pips.
----------------------------
The rest of the settings are for the Bollinger bands. They should stay at default unless you have good reason to change them.
Setting up the dashboard
In order to load the currencies that you wish to monitor in the dashboard, there are several steps to take. The currencies are stored by the indicator in a csv file in the experts/files folder and is called xxx_My_DashBoard.csv where xxx represents your broker's name.
There are 2 ways to load the displayed currencies. First is to hide all currencies that you do not wish to display in your marketwatch window. Alternatively, you can simply go to the CSV file and delete the unwanted currencies. Be sure to delete the entire line in the csv file, not just the entry. If you delete the currency but leave a blank line, the dashboard will try and display that blank with unpredictable results.
In order to create the CSV file, run load the indicator onto a blank chart. You will get an alert telling you to modify the CSV file to select your currencies. If you have already sorted out your currencies in the market watch window, then ignore this message, or else go modify the CSV as mentioned.
Then reload the dashboard. Now it should display correctly. The first time you are using it, it will most probably have missing data, so you will see the following indications :-
XX - this means there is no data for that currency & timeframe.
-- This means that there is data but not enough bars.
Be sure to then download the history data.
Please refer to the thread at the indo forum for a more indepth explanation of what the number, arrows and colors mean on the dashboard.
In short, a number with color implies that the 2 dev BB has been pierced with a - being the lower band and absence of a - being the upper band. The arrows indicate the PA relative to 2 moving average with a green arrow meaning PA is above or below both moving average in the direction of the trend(trend is the direction of fast MA relative to slow MA). A red arrow would be countertrend PA and is what you are really interested in since your trade direction would be with-trend. If the arrow has no color it means the stoch is between 20 and 80, so the arrow only gets color when the stoch indicates overbought or oversold.
Have fun, ask questions and please report any bugs.
EDIT : Please note that the scripts cannot be used without the trade manager.
Attached File(s)