Trading more often then not comes down to using the fundamentals for direction and technicals (fibs in this example) for price entry. I combine that with may basic idea when I shop for something-I want to buy most times when that something goes on "sale".
If you've read my posts before, you probably have a pretty good idea that I trade the equity/bond/carry trade connection. While it's true that equity and bond markets don't always control currency price, when things heat up on Wall Street, pairs like GBP/JPY move right along with them.
And if you read my post regarding the NFP, you'll remember that I thought it possible that equities might plunge off a strong NFP because it would reduce chances for another cut from the fed. What no one ever tries to predict is how the revisions might look. Last month's -4000 number had markets thinking recession and GBP/JPY responded accordingly with a drop. Once today's report revised up last month's number, there was a very good chance for the recession talk (at least for now) to get shelved and for markets to respond positively. The number certainly relieved the threat of recession for me and chances are for many others too.
OK, that's my opinion. What I still want is for price to "agree" with me. Wall Street isn't open when the NFP is released but futures markets are and they can be used as a reliable "gauge" of market sentiment. A strong rally is indicated when equity futures rise and bond futures fall, which is pretty much what happened after the release. The trend seemed to be set, so now it's a question of finding that "bargain" for an entry.
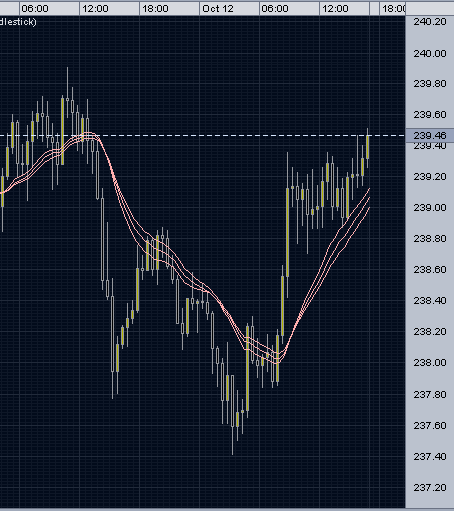
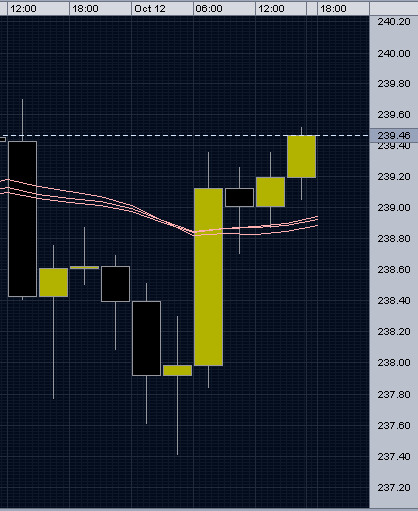
I've drawn a fib of the first 10 minutes of price movement on the chart because that reflected the initial burst. What I want to do now is see if price holds (finds support) at some fib levels because I feel more confident when that happens. The more price "reacts" to a fib, the better.
First thing to notice is that price retraces off the first burst pretty much back to the 50% level and finds support there. If you're super-aggressive, you might get in there for a smallish position, but I wanted to wait a bit before doing that. What's interesting is that from the 50 level-it rises almost exactly to the level of the original up move (100 fib level), where resistance is found. Two candles over, price again finds support, but this time at the next higher fib level (618). Some coincidence!
OK here's when an aggressive trader (or bargain hunter) can get in, but if you're conservative, you can still wait. Price moves around a bit and then finds support several times at the next fib level (786). Another excellent entry because price is definately holding (finding support) at higher fib levels.
So we have a trade and now we're looking for a target.
I was feeling pretty confident in the trade and I became more confident as I watched equity markets rise and bond prices fall. A conservative trader could go at least to the 138.6. I went for the 150. As it turned out, price peaked just about at the 161.8.
When you can spot the equity trend, you've spotted the trend for currency too.
If you've read my posts before, you probably have a pretty good idea that I trade the equity/bond/carry trade connection. While it's true that equity and bond markets don't always control currency price, when things heat up on Wall Street, pairs like GBP/JPY move right along with them.
And if you read my post regarding the NFP, you'll remember that I thought it possible that equities might plunge off a strong NFP because it would reduce chances for another cut from the fed. What no one ever tries to predict is how the revisions might look. Last month's -4000 number had markets thinking recession and GBP/JPY responded accordingly with a drop. Once today's report revised up last month's number, there was a very good chance for the recession talk (at least for now) to get shelved and for markets to respond positively. The number certainly relieved the threat of recession for me and chances are for many others too.
OK, that's my opinion. What I still want is for price to "agree" with me. Wall Street isn't open when the NFP is released but futures markets are and they can be used as a reliable "gauge" of market sentiment. A strong rally is indicated when equity futures rise and bond futures fall, which is pretty much what happened after the release. The trend seemed to be set, so now it's a question of finding that "bargain" for an entry.
I've drawn a fib of the first 10 minutes of price movement on the chart because that reflected the initial burst. What I want to do now is see if price holds (finds support) at some fib levels because I feel more confident when that happens. The more price "reacts" to a fib, the better.
First thing to notice is that price retraces off the first burst pretty much back to the 50% level and finds support there. If you're super-aggressive, you might get in there for a smallish position, but I wanted to wait a bit before doing that. What's interesting is that from the 50 level-it rises almost exactly to the level of the original up move (100 fib level), where resistance is found. Two candles over, price again finds support, but this time at the next higher fib level (618). Some coincidence!
OK here's when an aggressive trader (or bargain hunter) can get in, but if you're conservative, you can still wait. Price moves around a bit and then finds support several times at the next fib level (786). Another excellent entry because price is definately holding (finding support) at higher fib levels.
So we have a trade and now we're looking for a target.
I was feeling pretty confident in the trade and I became more confident as I watched equity markets rise and bond prices fall. A conservative trader could go at least to the 138.6. I went for the 150. As it turned out, price peaked just about at the 161.8.
When you can spot the equity trend, you've spotted the trend for currency too.
Attached Image (click to enlarge)