hi guys
once again ill keep this short this time
ill start doing my in depth analysis as of the new yr---im just tied up in a lot more things...ill keep u guys updated soon
weekly chart:
--we had a bearish past week and have closed below the weekly 100sma ( till we dont get a close back above it--bears are in power)
--everyone should chk the bearish beauty of the monthly candle
--nxt tgt could be possibly 200ema weekly
-- we have closed near the yearly pivot as mentioned in my prev analysis
daily chart:
-- last week -last 5 candles--very choppy--although slow bearish bias
-- we have conquered all 3 monthly supports (ms1,ms2,ms3)--indicating so far a strong bear trend
--we are below 50ema, 100sma 200ema, ms2, very near ms3 and YP --all to me indicating bear trend so far -BUT a lot of support here.
--bear tgts below the low so far would be weekly 200ema nd then YS1 (211.85) ---the monthly 50ema is at approx 214.75---achievable !
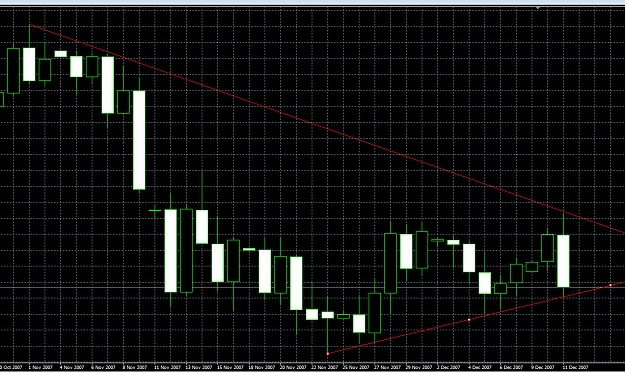
4hr chart:
--still showing a bearish trend
-- price is below Upper 4hr TL
--price below 100sma,200ema,50ema
--a close and continuation above 50ema/4hr could possibly suggest a start on and intraday bull trend.
--i see a lot of confluence of R btw 224 and 225--watch out for the bulls influx if these levels are broken decisevely. (especially 224.15 region)
--so far the pic is still bearish on 4hr tf
1hr chart:
--still below the 100sma and 50ema
--could be just a retracement form the low it made on friday rather then a reversal ( ie--i still dont consider this a reversal--yet ! )
--although we do have an unideal bullish butterfly on 1hr which is presently in action
well lets see what this week brings us.
as usual ill be trading from lower tf's
ill see whether i can share daily analysis this week
have fun ya'all
once again ill keep this short this time
ill start doing my in depth analysis as of the new yr---im just tied up in a lot more things...ill keep u guys updated soon
weekly chart:
--we had a bearish past week and have closed below the weekly 100sma ( till we dont get a close back above it--bears are in power)
--everyone should chk the bearish beauty of the monthly candle
--nxt tgt could be possibly 200ema weekly
-- we have closed near the yearly pivot as mentioned in my prev analysis
daily chart:
-- last week -last 5 candles--very choppy--although slow bearish bias
-- we have conquered all 3 monthly supports (ms1,ms2,ms3)--indicating so far a strong bear trend
--we are below 50ema, 100sma 200ema, ms2, very near ms3 and YP --all to me indicating bear trend so far -BUT a lot of support here.
--bear tgts below the low so far would be weekly 200ema nd then YS1 (211.85) ---the monthly 50ema is at approx 214.75---achievable !
4hr chart:
--still showing a bearish trend
-- price is below Upper 4hr TL
--price below 100sma,200ema,50ema
--a close and continuation above 50ema/4hr could possibly suggest a start on and intraday bull trend.
--i see a lot of confluence of R btw 224 and 225--watch out for the bulls influx if these levels are broken decisevely. (especially 224.15 region)
--so far the pic is still bearish on 4hr tf
1hr chart:
--still below the 100sma and 50ema
--could be just a retracement form the low it made on friday rather then a reversal ( ie--i still dont consider this a reversal--yet ! )
--although we do have an unideal bullish butterfly on 1hr which is presently in action
well lets see what this week brings us.
as usual ill be trading from lower tf's
ill see whether i can share daily analysis this week
have fun ya'all