Joined Apr 2013
|
Status: Now I know you
|5,816 Posts
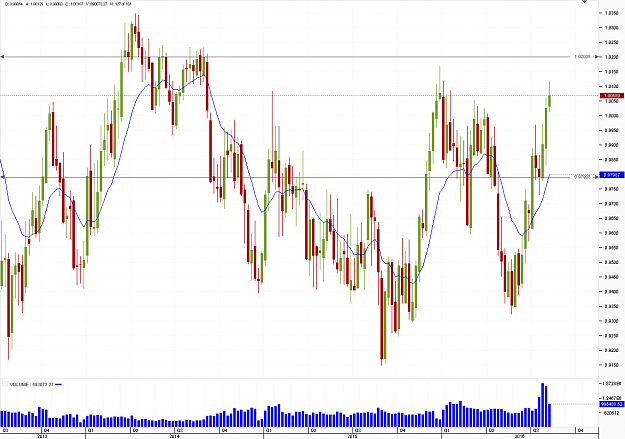
Tools used for Analysis: EMA (14 ), candlestick chart ,Horizontal lines, volume. support and resistance point. Downside support exists at 0.9790 upside resistance exists at 1.0200 volume direction High price moving in the upward direction after testing support area i.e 0.9790 can stay in upside direction for coming next 2 weeks My expected targeton 3rd Octoberfor AUD/CADis : 1.0200
Attached Image (click to enlarge)
don't predict direction, but dance with flow of water
Joined Apr 2013
|
Status: Now I know you
|5,816 Posts
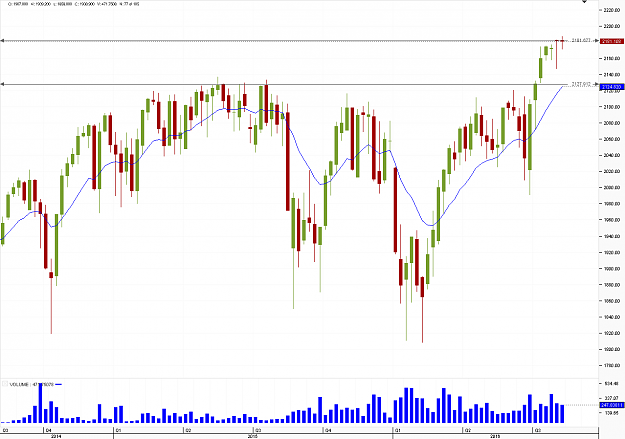
USA500.IDX/USD Tools used for Analysis: EMA (14 ), candlestick chart ,Horizontal lines, volume. support and resistance point. Downside support exists at 2124.85 upside resistance, we are in no mean's land volume direction High price moving in the upward direction after crossing all resistance can stay in range for coming next 2 weeks in these conditions we often see a Doji formation. My expected targeton 3rd OctoberforUSA500.IDX/USDis : 2181.87
google "priceaction113" for more
Attached Image (click to enlarge)
don't predict direction, but dance with flow of water
Joined Apr 2013
|
Status: Now I know you
|5,816 Posts
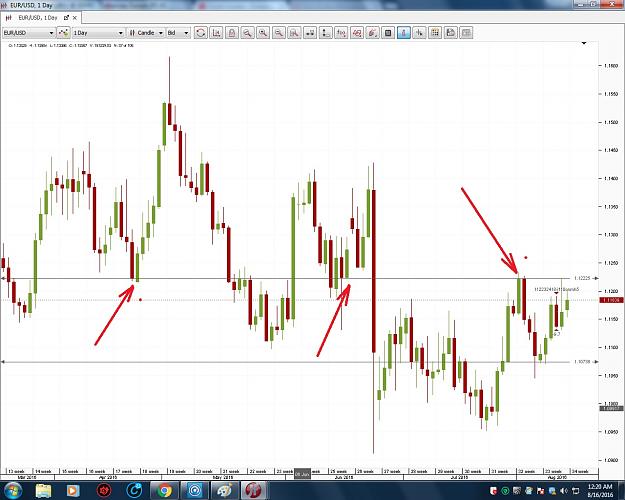
I usually prepare "if" set up with the time you will get the grip of this concept so 1st if set up in Eur/USD upper side resistance is @ 1.1222 and support at @ 1.1073 if price move above 1.1222 area and stay over for up 4H it is a sing of break and if it just pops up and then comes back again bellow that area it will be stop loss grabber move/ so short if price test 1.1222 and come back or long above this area with the stop just bellow this area
Attached Image (click to enlarge)
don't predict direction, but dance with flow of water
Joined Apr 2013
|
Status: Now I know you
|5,816 Posts
great master reveals the secret.
sure,
already wrote nearly 3000 pages of it.
NIMBLE..........no mind.
Know self, know thy enemy.
TIMING.
skill.
MOST OF ALL, ALWAYS, Grossly over Capitalised with all sorts tricks in my bag,manouver Dig out of any possibilities.
Also I can see where the BIG boys and FRIENDS hitting me.
Most importantly, i know what the indicators peeps will be doing, when i See their inflow.
Me used to make the patterns for trading.
enough said, My head becoming too BIG.
No trumpets.Unless i wanna fall.
read thread, learn. I gave all already.
regards
If i become arrogant, I know I will fall.
It comes just when i feel too cock sure of myself.
don't predict direction, but dance with flow of water
Joined Apr 2013
|
Status: Now I know you
|5,816 Posts
here it is
MOST OF ALL, ALWAYS, Grossly over Capitalised with all sorts tricks in my bag,manouver Dig out of any possibilities.
Also I can see where the BIG boys and FRIENDS hitting me.
Most importantly, i know what the indicators peeps will be doing, when i See their inflow.
Me used to make the patterns for trading.
don't predict direction, but dance with flow of water