• Home
  • Forums
  • Trades
  • News
  • Calendar
  • Market
  • Brokers
  • Login
  • Join
  • User/Email: Password:
  • 7:07am
Menu
  • Forums
  • Trades
  • News
  • Calendar
  • Market
  • Brokers
  • Login
  • Join
  • 7:07am
Sister Sites
  • Metals Mine
  • Energy EXCH
  • Crypto Craft

Options

Bookmark Thread

First Page First Unread Last Page Last Post

Print Thread

Similar Threads

Taxing income from forex trading around the world 22 replies

Fundamental Data for countries around the world? 3 replies

MT4-Indicator for showing holiday and celebration days around the world? 0 replies

Best Brokers All Around The World 2 replies

  • Trading Journals
  • /
  • Reply to Thread
  • Subscribe
  • 127
Attachments: Trading around the world
Exit Attachments

Trading around the world

  • Last Post
  •  
  • 1 89Page 101112 13
  • 1 9Page 1011 13
  •  
  • Post #181
  • Quote
  • Jun 9, 2014 7:04am Jun 9, 2014 7:04am
  •  TraderRolf
  • Joined Mar 2014 | Status: Member | 163 Posts
I have been talking to an investor who has been asking why I take positions that are not even 0,5% of the account. Although he enjoys the performance, he is wanting a higher return on his investment. I shared with him a few statistics that I share with many retail traders that are looking to make the transition to a 'full time trader', trading for a living.

If you want to trade for a living, you have to think long term.

- Assuming you take 4 trades per week, this will result in around 1000 trades after 5 years.

- If you know that your winrate is going to be 50%, which is a very reasonable and acchievable asumption, what are the probabilities of a series of 3, 4, 5, 6, 7, 8, 9, 10..... consecutive losing trades?

- You will lose every 2nd trade that you take over the long term. The math is easy here:
2 consecutive losers: 0,5*0,5 = 0,25 = 25%
....
5 consecutive losers: 0,5*0,5*0,5*0,5*0,5 = 0,031 = 3,1% (not high at all, right!?)
10 consecutive losers: 0,5*0,5*0,5*0,5*0,5*0,5*0,5*0,5*0,5*0,5 = 0,001 = 0,1% (this is so low, why even bothering, you might think)

- But what does this mean over the course of 1000 trades?
5 consecutive losers will happen to you: 0,031*1000 = 30 times (every 40 trading days)
10 consecutive losers will happen to you: 0,001 * 1000 = 1 time

- What if you risk 2% per trade? (most see this as a safe amount)
Having 5 consecutive losers means losing 9,6% of your account (every 40 trading days)
Having 10 consecutive losers means losing 18,29% of your account

- What if you risk 5% per trade?
Having 5 consecutive losers means losing 22,6% of your account (every 40 days)
Having 10 consecutive losers means losing 40% of your account (This means you have to recover 66,6% - how long will this take you?)

I hope you get the idea and I hope I can make you think more long term. Because, when you want to trade for a living you have to think long term!
Learn from yesterday, live for today and hope for tomorrow.
 
 
  • Post #182
  • Quote
  • Jun 9, 2014 12:06pm Jun 9, 2014 12:06pm
  •  TraderRolf
  • Joined Mar 2014 | Status: Member | 163 Posts
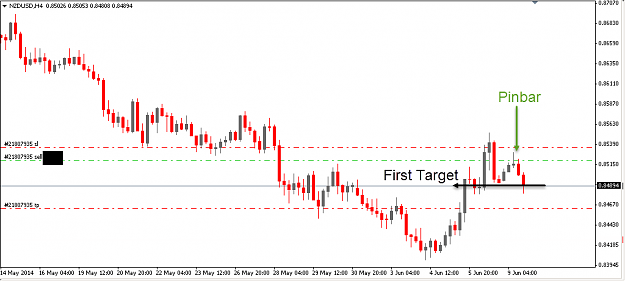
Great way to start the week. Thanks to the f*** hot weather here in Bangkok, I stayed in today and delayed all my things I had to do for the evening and so I was able to get that very nice trade on the Kiwi.

having the D1 short bias I talked in my video from yesterday, was looking for short entries with additional confirmation and for a better price. Well, look at this H4....
Attached Image (click to enlarge)
Click to Enlarge

Name: kiwi.png
Size: 19 KB
Learn from yesterday, live for today and hope for tomorrow.
 
 
  • Post #183
  • Quote
  • Jun 10, 2014 3:24am Jun 10, 2014 3:24am
  •  LamerTrader
  • | Joined Jul 2012 | Status: Ninja | 537 Posts
Quoting TraderRolf
Disliked
Great way to start the week. Thanks to the f*** hot weather here in Bangkok, I stayed in today and delayed all my things I had to do for the evening and so I was able to get that very nice trade on the Kiwi. having the D1 short bias I talked in my video from yesterday, was looking for short entries with additional confirmation and for a better price. Well, look at this H4.... {image}
Ignored
Took the same trade (slightly worse entry, since i simply entered with a limit sell at the left eye of the daily pinbar).
Did you take profit at the FTA?
Seeing a double pinbar on the daily I thought we are going to crack that level, so i held full position. I might been a stupid idea...
It's all psychology...
 
 
  • Post #184
  • Quote
  • Jun 10, 2014 5:33am Jun 10, 2014 5:33am
  •  TraderRolf
  • Joined Mar 2014 | Status: Member | 163 Posts
Quoting LamerTrader
Disliked
{quote} Took the same trade (slightly worse entry, since i simply entered with a limit sell at the left eye of the daily pinbar). Did you take profit at the FTA? Seeing a double pinbar on the daily I thought we are going to crack that level, so i held full position. I might been a stupid idea...
Ignored
servus Lametrader,

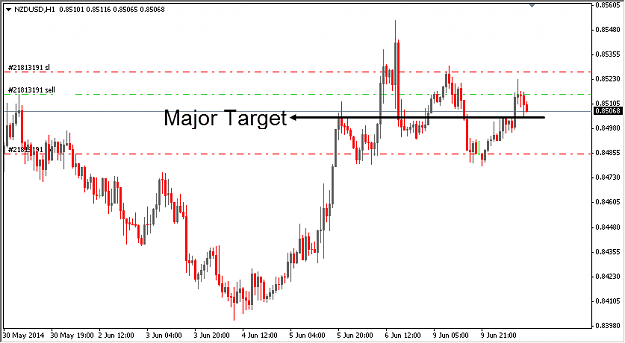
I usually take around 80-90% profit at the first target I can identify. And since, we are goingg against some bullish pinbar-like weekly candle, I took off almost everything off at the first target I showed.

But today, there was another very nice entry on the kiwi. Again, first target has been hit and the biggest part of my position I took off already. This is my income and I don't wanna give back too much if I see it moved already to where I planned it would go. Even prices are cheap as f*ck in Thailand, there is no reason why should start gambling with your income. Just take as much 'safe' money as possible and repeat it as often as possible
Attached Image (click to enlarge)
Click to Enlarge

Name: kiwi.png
Size: 12 KB
Learn from yesterday, live for today and hope for tomorrow.
 
 
  • Post #185
  • Quote
  • Jun 10, 2014 9:48am Jun 10, 2014 9:48am
  •  EinsWaltz
  • | Joined Sep 2013 | Status: Member | 122 Posts
Hi...rolf...may i know what is your entry criteria? i see in your chart u dont use any trendlines?
 
 
  • Post #186
  • Quote
  • Jun 10, 2014 11:16am Jun 10, 2014 11:16am
  •  TraderRolf
  • Joined Mar 2014 | Status: Member | 163 Posts
Quoting EinsWaltz
Disliked
Hi...rolf...may i know what is your entry criteria? i see in your chart u dont use any trendlines?
Ignored
hello EinsWaltz,

If you watch my videos, you will see I use horizontal lines, and Fibs. I don't use any trendlines as they are too subjective for my taste.
I basically trade 3 different types of Price Action and 'orderflow' if you want to use that new-age term retail love so much. The entry criteria for each vary a lot and are based on the situation as well. You might want to check my youtube channel, where I talk about some trades I took and what made me take them. (My youtube channel link: https://www.youtube.com/channel/UC7p...3n2tDlt-QTLgAg)

I hope this will help you answer some of your questions
Learn from yesterday, live for today and hope for tomorrow.
 
 
  • Post #187
  • Quote
  • Jun 11, 2014 12:44am Jun 11, 2014 12:44am
  •  Dumper
  • | Joined Aug 2013 | Status: fxmaster | 73 Posts
Update on NZD
Attached Image (click to enlarge)
Click to Enlarge

Name: usdcad.png
Size: 57 KB
 
 
  • Post #188
  • Quote
  • Jun 11, 2014 1:28am Jun 11, 2014 1:28am
  •  TraderRolf
  • Joined Mar 2014 | Status: Member | 163 Posts
Quoting Dumper
Disliked
Update on NZD {image}
Ignored
Good trade. although this is no supply level in the classical sense, it's always hard to argue against if one makes money

keep it up!
Learn from yesterday, live for today and hope for tomorrow.
 
 
  • Post #189
  • Quote
  • Jun 11, 2014 3:06am Jun 11, 2014 3:06am
  •  LamerTrader
  • | Joined Jul 2012 | Status: Ninja | 537 Posts
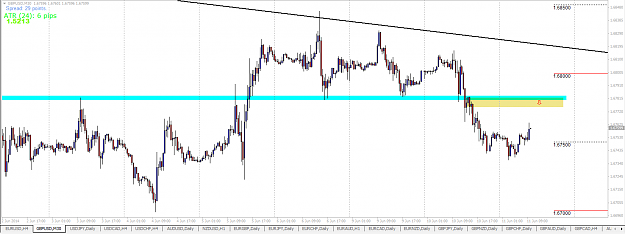
GU

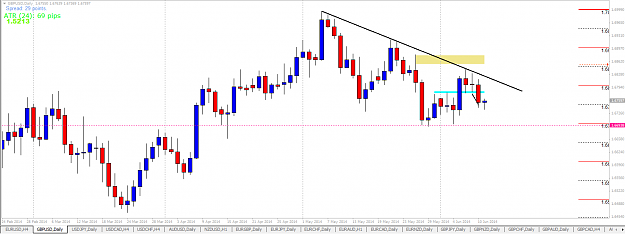
I guess no one could argue the bearish bias on the daily chart. (For the record: I hate trend-lines, and I don't trade them, but sometimes it's worth to look out for them, especially if they are obvious.) Anyway it seems price found supply at the trend-line, BUT it also found demand. Price was NOT able to close under the 1.68 for 2 days.
(Although I would argue people who say, that this close above 1.68 is such a big deal...)
Attached Image (click to enlarge)
Click to Enlarge

Name: GU_daily.PNG
Size: 45 KB

Anyway on the 30m we see the consolidation and the beautiful break. We also have some weak looking supply level here, but this will only help me to place my entry better.
Attached Image (click to enlarge)
Click to Enlarge

Name: GU_30m.PNG
Size: 55 KB


However mind the upcoming GBP news!
Cheers!
It's all psychology...
 
 
  • Post #190
  • Quote
  • Jun 11, 2014 3:21am Jun 11, 2014 3:21am
  •  TraderRolf
  • Joined Mar 2014 | Status: Member | 163 Posts
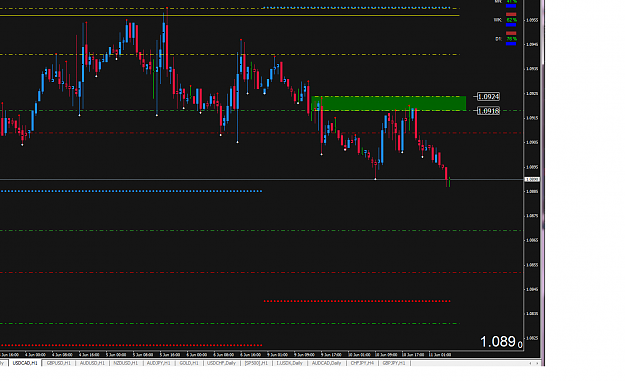
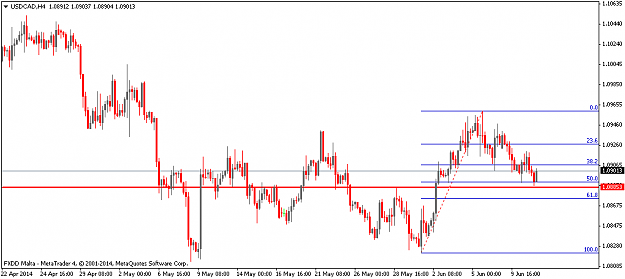
I have been talking about 1.0885 on USDCAD for days. It does not get better than this. if you need an example for how a setup should look like, print this one. This is as easy as trading and making money gets
Attached Image (click to enlarge)
Click to Enlarge

Name: loonie.png
Size: 25 KB
Learn from yesterday, live for today and hope for tomorrow.
 
 
  • Post #191
  • Quote
  • Jun 11, 2014 4:27am Jun 11, 2014 4:27am
  •  LJTraff
  • | Joined Sep 2013 | Status: Member | 2 Posts
Hi TraderRolf - great thread you have here, I haven't had the chance to read through all the posts or watch your videos but will do so this week.

Regarding the USDCAD chart above, would you mind please clarifying the factors which made you take the trade - Fibs & support and previous resistance?

Thanks,

LJ
 
 
  • Post #192
  • Quote
  • Jun 11, 2014 6:25am Jun 11, 2014 6:25am
  •  AlexA
  • | Joined Feb 2010 | Status: Member | 28 Posts
Hi Rolf, would you mind share a blank template of a trade journal?
So we can start having our own journals.
 
 
  • Post #193
  • Quote
  • Jun 11, 2014 9:45am Jun 11, 2014 9:45am
  •  TraderRolf
  • Joined Mar 2014 | Status: Member | 163 Posts
Quoting LJTraff
Disliked
Hi TraderRolf - great thread you have here, I haven't had the chance to read through all the posts or watch your videos but will do so this week. Regarding the USDCAD chart above, would you mind please clarifying the factors which made you take the trade - Fibs & support and previous resistance? Thanks, LJ
Ignored
Hello LJ and welcome to my thread. Thanks for your feedbac. Please review my posts and the videos. Then you willl know why I took the trade.

Quoting AlexA
Disliked
Hi Rolf, would you mind share a blank template of a trade journal? So we can start having our own journals.
Ignored
Hi AlexA,
I'll do this shortly. Just edit a few things to make it easier for people without excel knowledge. cheers
Learn from yesterday, live for today and hope for tomorrow.
 
 
  • Post #194
  • Quote
  • Jun 11, 2014 11:14am Jun 11, 2014 11:14am
  •  TraderRolf
  • Joined Mar 2014 | Status: Member | 163 Posts
Trading is a performance game

When you turn on TV you see Real Madrid and Christiano Ronaldo performing at his best. You see Usain Bolt running the 100 meters in another world record time...

And all those top performers always make it look so easy – almost effortless. But when you see any top sports team playing on TV and any athlete setting a world record, you just see 5% of what they are doing. One match might take 2 hours and teams play 2 matches per week – that’s 4 hours in total. But all these top athletes are training 7 days a week, 10 hours per day, almost 365 days per year.

Athletes work on their strength and endurance. They work with sport psychologists. These days they even work with university, analyzing every part of their movement to gain that extra second. They try to improve their team spirit. They study their opponents, watching and analyzing them for hours and paying attention to every little detail. And when it’s matchday they have a perfectly defined game-plan. They are prepared for everything that might happen. They know every player from the opposite team and they know their strengths and weaknesses. If they score an early goal, they know how to change their strategy. If they are behind by 1 goal, all players exactly know how to react…

And this mindset should be yours as well when it’s about trading. You have to do the market analysis before markets open, you have to study your instruments, you have to test and tweak your method, questioning every variable. You have to have a fixed gameplan, being ready for everything that might happen on the markets. Where are the areas of interest for your instruments? What do you want to see once price gets there? Do you have news in the next trading session? What if it doesn’t look like it? What do you do about this? How do you manage your risk? What are the potential trouble areas? How you are going to deal with them? Are there any spots where you can add to your position, why, how? Do you cut your position when it’s moving against you? Why? Where? …

And once your trading day is over, you HAVE to analyze everything that has happened. Did you take a trade? was it a good entry? Could it have been better? Did you miss a setup? Why? Could you have managed your trade better? How? Why? ….

If you are unsure at any time what to do when the markets are moving, you haven’t done your job correct. Nothing that happens during a trading session should catch you by surprise and leave you uncertain.

The trading industry is highly competitive and if you don’t work on your skills, the only thing that is going to happen is that your account is going to transferred to those that do.

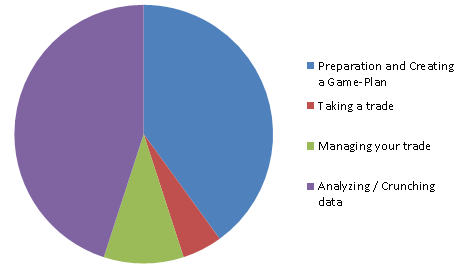
This graph shows how you should prioritize and manage your time in trading….
Attached Image
Learn from yesterday, live for today and hope for tomorrow.
 
 
  • Post #195
  • Quote
  • Jun 11, 2014 1:14pm Jun 11, 2014 1:14pm
  •  Dumper
  • | Joined Aug 2013 | Status: fxmaster | 73 Posts
Quoting TraderRolf
Disliked
{quote} Good trade. although this is no supply level in the classical sense, it's always hard to argue against if one makes money keep it up!
Ignored
Ty, Rolf.

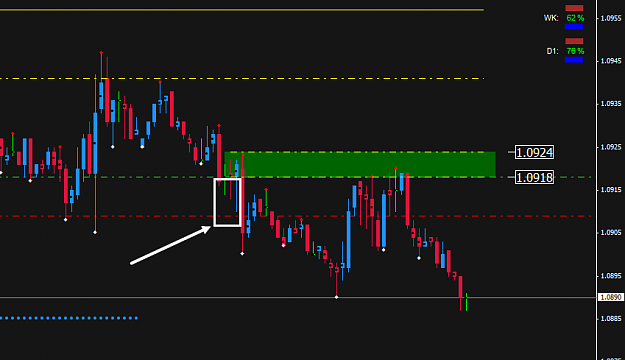
Can you explain to me why you dont think that was a supply level? In my schoolbook its a place where supply exceeds demand therefore a supplylevel. If you look closely, the whole chart is filled with supply demand levels. You just need to filter the good levels out. I purely trade supply and demand levels with some fib filtering.
 
 
  • Post #196
  • Quote
  • Jun 11, 2014 2:19pm Jun 11, 2014 2:19pm
  •  forexpiet
  • | Joined Apr 2006 | Status: Member | 238 Posts
Quoting Dumper
Disliked
{quote} Ty, Rolf. Can you explain to me why you dont think that was a supply level? In my schoolbook its a place where supply exceeds demand therefore a supplylevel. If you look closely, the whole chart is filled with supply demand levels. You just need to filter the good levels out. I purely trade supply and demand levels with some fib filtering.
Ignored
I would like to have a try on that if you do not mind. I think after the first big red down candle at the start of the supply level price should have resumed its course immediately. Now it retraced immediately almost have of its original move down. Yest my 2 cents though ......
Posting Demo charts, mirroring some of them live.
 
 
  • Post #197
  • Quote
  • Jun 11, 2014 3:38pm Jun 11, 2014 3:38pm
  •  Dumper
  • | Joined Aug 2013 | Status: fxmaster | 73 Posts
Quoting forexpiet
Disliked
{quote} I would like to have a try on that if you do not mind. I think after the first big red down candle at the start of the supply level price should have resumed its course immediately. Now it retraced immediately almost have of its original move down. Yest my 2 cents though ......
Ignored
Well, a chart is full of demand and supply-levels. If you look at any chart at any timeframe you see that price moves from one level to another and so on. Of course you get higher odds if there is a strong departure from the level but its still a level.

For me this was a High odds trade still departure could be better.

Retrace to FIB 50%
Moved away atleast 3 times the level
H4 CP-pattern
H1 Supply
5:1 ratio TP

If you want to learn more I really recommend looking at Sam Seidens webinars on fxstreet, the master on supply/demand trading
 
 
  • Post #198
  • Quote
  • Jun 11, 2014 11:08pm Jun 11, 2014 11:08pm
  •  TraderRolf
  • Joined Mar 2014 | Status: Member | 163 Posts
Quoting Dumper
Disliked
{quote} Well, a chart is full of demand and supply-levels. If you look at any chart at any timeframe you see that price moves from one level to another and so on. Of course you get higher odds if there is a strong departure from the level but its still a level. For me this was a High odds trade still departure could be better. Retrace to FIB 50% Moved away atleast 3 times the level H4 CP-pattern H1 Supply 5:1 ratio TP If you want to learn more I really recommend looking at Sam Seidens webinars on fxstreet, the master on supply/demand trading
Ignored
Hi Dumper,
the problem with this level and the reason why this would not classify as a supply zone as Sam Seiden trades them is that a supply&Demand zone has to be 'narrow'. But the one you drew had some pretty big wicks before it started tanking. How strong can the supply imbalance be if price was able to go that much lower and then come back again?

I made a video where I talk about the difference between S&D and S&R.
https://www.youtube.com/watch?v=1643nYLKn44

cheers
Attached Image (click to enlarge)
Click to Enlarge

Name: S&D.png
Size: 16 KB
Learn from yesterday, live for today and hope for tomorrow.
 
 
  • Post #199
  • Quote
  • Jun 12, 2014 8:19am Jun 12, 2014 8:19am
  •  renanc93
  • | Joined Feb 2013 | Status: Member | 152 Posts
Hello Rolf,
And how about the supply level at GBPUSD around 1.6873 you have something to comment?
Thanks.
"In God we trust."
 
 
  • Post #200
  • Quote
  • Jun 13, 2014 12:00am Jun 13, 2014 12:00am
  •  TraderRolf
  • Joined Mar 2014 | Status: Member | 163 Posts
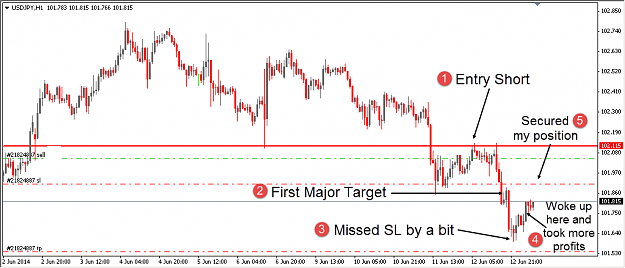
Here my last trade for the week. Not optimal since I left the position over night and woke up tp see my trade missed the tP by a few pips. i immediatelly took 90% off and now only have a very small position open. I can't tell you this often enough. Never gamble with your income. Take trading seriously, then everything is possible. However, still a very nice profit overall on this one!

I am planing some videos where I answer all questions that I am receiving through twitter and prive message. So, if you have anything that you would like to see a video about, just message me here or per PM. Have a good weekend all!!!


Attached Image (click to enlarge)
Click to Enlarge

Name: usdjpy.png
Size: 31 KB

Attached Image (click to enlarge)
Click to Enlarge

Name: possible.png
Size: 462 KB
Learn from yesterday, live for today and hope for tomorrow.
 
 
  • Trading Journals
  • /
  • Trading around the world
  • Reply to Thread
    • 1 89Page 101112 13
    • 1 9Page 1011 13
0 traders viewing now
  • More
Top of Page
Forex Factory Blog Updated: Alerting All Members
  • Facebook
  • Twitter
About FF
  • Mission
  • Products
  • User Guide
  • Media Kit
  • Blog
  • Contact
FF Products
  • Forums
  • Trades
  • Calendar
  • News
  • Market
  • Brokers
  • Trade Explorer
FF Website
  • Homepage
  • Search
  • Members
  • Report a Bug
Follow FF
  • Facebook
  • Twitter

FF Sister Sites:

  • Metals Mine
  • Energy EXCH
  • Crypto Craft

Forex Factory® is a brand of Fair Economy, Inc.

Terms of Service / ©2022