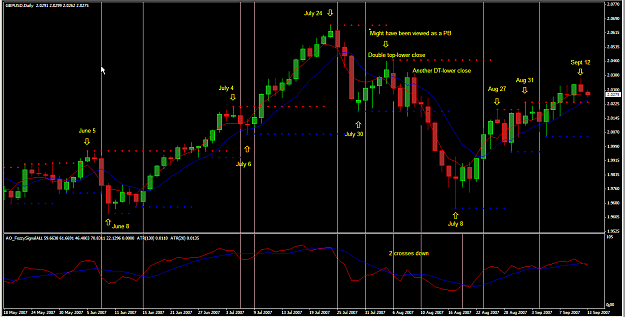
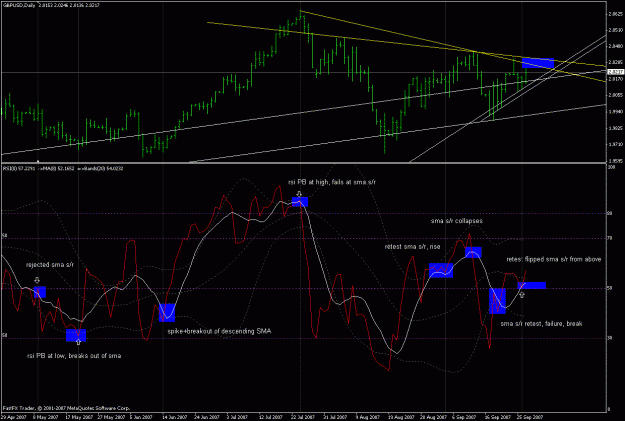
Here's how I Fozzy-style trade using Daily charts:
Initially it was my intention to only discuss PBs and a Fozzy-style indicator, but I have since decided to show how I use the basic 8 over 8 Fozzy indicator with other PA indicators.
First: this works for me, maybe it will work for you too. If not, I hope this information will help others to use PA, and especially PBs more. Don’t trade this way without a thorough understanding of what I am doing and only after backtesting and demo trading!
A few words about the criteria I like to use and why:
I’m looking for “A” trades; the very best, high quality setups. There are too many good opportunities to waste time with ‘marginal’ trades. I look at Monthly and Weekly charts to get a ‘feel’ for what a pair is doing; I trade off the Daily primarily and occasionally use the 4 Hour for an early entry. (I’ll discuss that in a later post; for now it’s all about the Daily chart).
PBs are well defined and many have their own interpretation of this indicator. I like a small body (I use candles because to me they are more ‘visual’) with a long wick; I don’t have any set rules about size and percentages and so-forth, I just know what I like to see; and certainly a very long ‘nose’ with a small body is ideal; there’s one on the attached chart. Some traders call this discretion.
Fozzy-style trading is about trend reversal, it may be for only a day or two or it may be much longer; again the attached chart shows both (it’s one of my favorites, GBP/USD. Like smjones, GBP/USD has been good to me too!). IMO Pin Bars are also about trend reversal, so when a PB shows up with a Fozzy-style trade signal, I pay attention. But only after I have seen two days of price movement in the same direction (the PB may or may not be included in that two days). I will not trade a reversal after one day of movement in the opposite direction; too risky. I may miss a few good trades, but I will be kept out of more losers. I want some momentum. I have two MAs on the chart for visual effect; helps me ‘see’ the current trend. It’s nice when these close and/or cross, but I don’t NEED that. I DO NEED the RSI/MA (Fozzy indicator) lines to be closing, close and/or crossing; that’s a large part of the trade signal. That’s one of the benefits of trading Daily charts (4 hour too), there’s NO HURRY, we have plenty of time to make a trade decision after carefully examining ALL the factors that go into our decision. One more thing: there will be Fozzy-style crosses as shown on the chart, but if I don’t have some form of PA agreement, I will ignore the cross; again, too many excellent opportunities to take unnecessary risks.
OK the chart:
June 5: possible PB, but RSI/MA not close. Wait!
June 6: spinning top, good!
June 7: Trade signal at the end of the day; Fozzy cross, MA’s cross with a “Bridge”, large bearish candle=momentum (I would have looked at the 4 hour chart during the day for possible early entry, more on that later)
June 8: 150+ pip trade with a small S/L needed
June 8: PB reversal? Wait and see
June 15: Fozzy cross and MA cross
June 18: Buy signal; 400+ pips and small S/L
July 4: PB? Not a trade setup! July 2 candle is UP, 3rd is Down, 4th is UP……No trade!
July 6: PB looks good, Fozzy cross possible, watching 4 hour for confirmation.
July 9: Watch the 4 hour chart and BUY, 350+ pip trade, confirmed on the 10th
July 11: PB? No!
July 16: PB? No!
July 19: False Fozzy, PA does not agree with this RSI/MA cross.
July 20: PB? No!
July 24: PB? Yes, confirmed during the day on the 25th. 350+ pip trade
July 30: PB?
July 31: Fozzy cross not close enough for me; in hindsight I missed a trade, but did NOT break my rules!
Aug 1: Another PB?
Aug 2: Buy signal confirmed with the 4 hour; small payout, about 90+ pips
Aug 3: PB?
Aug 6: PB confirmed on the 4 hour; but at the end of the day we have a Double Top with a lower close, nice PA to stay in the Sell! 130+ pips
Aug 8: PB? No the bosy of this candle is waaaaaay too big.
Aug 8 & 9: Same scenario as Aug 3 & 6 with the Double Top; Aug 9 has a Fozzy cross down
Aug 10: Sell……………but at the end of the day, is that a PB that just formed? Lock in your profit for current trend, then wait and see.
Aug 11: Sell continues………….550+ pips possible
Aug 16: PB? Fozzy indicator not close enough to decide, will wait one more day
Aug 17: Glad I waited………….amazing PB; but it takes three days for a Fozzy cross AND a MA cross AND a price break of the top of the PB
Aug 23: Buy at the price break, good momentum now, 200+ pips
Aug 27: PB?
Aug 28: This is a tough one. No Fozzy cross or even close on the Daily; the 4 hour would put you in the trade OR a break of the bottom of the PB during the day on the 28th.
Aug 29: If you waited, it was a loser.
Aug 31: PB? I need two consecutive days of price movement in the same direction; no here! 29th was UP, 30th was DOWN, 31st was UP; no trade!
Sept 12: PB? OK, time to “adjust the rules”. 7th was UP, 10th was DOWN, 11th was UP. But wait, the candle on the 10th was a 2 pip Doji; it doesn’t count, I will “ignore” it. Plus there was a Fozzy SELL on the 12th. When there is a Fozzy signal and a nice PB, I will trade that. I’m still in that trade!
Hopefully this explanation is helpful and I haven't left anything out or made too many errors. There will be some questions; I’ll do my best to answer them as time permits. And I will post something later about using the same indicators and criteria on a 4 hour chart. In the meantime, if that interests you, why not spend some time researching that on your own. Cheers!
Almost forgot: I do use S & R levels as appropriate; that's why I have the red and blue dot indicator to remind me of past levels of significance AND I will use Fib levels and retracements; but I don't see a need to explain that, everyone has their own method of applying these.
Attached Image (click to enlarge)