• Home
  • Forums
  • Trades
  • News
  • Calendar
  • Market
  • Brokers
  • Login
  • Join
  • User/Email: Password:
  • 2:54pm
Menu
  • Forums
  • Trades
  • News
  • Calendar
  • Market
  • Brokers
  • Login
  • Join
  • 2:54pm
Sister Sites
  • Metals Mine
  • Energy EXCH
  • Crypto Craft

Options

Bookmark Thread

First Page First Unread Last Page Last Post

Printable Version

Similar Threads

Please suggest a simple & effective Method/System of "Trading System" Forum to newbie 176 replies

Is technical analysis subjective or objective? 1 reply

Simple & Consistent Fibbing Method 1,913 replies

SwingRider - Simple, Low-Maintenance, Effective 55 replies

my Anytimeframe but made for scalping simple yet effective supermethod 17 replies

  • Trading Systems
  • /
  • Reply to Thread
  • Subscribe
  • 257
Attachments: Simple, Non-subjective, Consistent, Effective
Exit Attachments

Simple, Non-subjective, Consistent, Effective

  • Last Post
  •  
  • Page 1 23456 33
  • Page 1 234 33
  •  
  • Post #1
  • Quote
  • First Post: Edited Mar 19, 2014 10:00pm Dec 24, 2013 1:18pm | Edited Mar 19, 2014 10:00pm
  •  Ap3
  • Joined Sep 2011 | Status: Member | 145 Posts
Hello. I'd like to share a strategy that adheres to the principles of being simple, non-subjective, consistent, and most importantly effective. If a trading strategy is not based on sound ideals it is doomed from the start, no matter how many indicators or filters you throw at it. Beginners please understand this.

This thread is open to all. One of the benefits of the above four principles is that anyone can learn the mechanics of the system quickly, because it is not complicated. This does not mean you will be successful quickly. The real work lies in the application of the strategy day in and day out, and trusting in the process of your edge proving itself over time. But basically this is a freestyle thread. Feel free to post comments, ideas, trades, whatever you want. As long as it's positive, productive, and in-line with the topic.

I will post the rules up front, and then if there is any interest we might discuss how the four principles relate to the strategy.

The goal is to stack H1 and H4 positions in the direction of the daily and weekly trend. How is this accomplished?

1. Buy only if price is up on the day
2. Sell only if price is down on the day
3. All H4 engulfing bars may be taken
4. H1 engulfing bars are ideal after a pullback, but not required
5. Trigger is a spread +1 break of the engulfing bar
6. Stop is 10 pips below previous swing low or engulfing bar
7. Move stop to break-even at 1:1RR, and hold for minimum 2:1RR. Once a comfortable 2:1 has been achieved, meaning 3:1 or 4:1, move stop to 2:1. Then either hold on for the ride or trail behind previous closed daily or H4 candle.
8. Previous monthly, weekly, and daily high/lows will be the only lines used for support/resistance. These lines can also be used for profit targets and directional bias. For example, it would be prudent not to sell into a market that has just broken its previous weekly or monthly high.
9. Each trade in a stack is treated as a separate position unto itself

Attached Image (click to enlarge)
Click to Enlarge

Name: gj h1 stacking.png
Size: 28 KB

From this chart example, you can see there were potentially 5 stacking signals in the last 2-3 days. All signals triggered above their respective daily opens, and all triggered on the next candle. The only exception is signal #3, which I would consider more of a 2-bar engulf pattern (the yellow arrow being on bar 2). Price has also recently broken its previous weekly high, while also breaking previous daily high at least the last three days in a row. Both are excellent indications of further upward bias.

Take note of the Multi-meter in the top right corner. H1 through MN1 are all up relative to their current opens. If you had taken any or all of these signals, there would be absolutely no reason to exit any of them at this point. Quite the opposite. You'd be looking to stack as many valid positions in this direction as you can, until the market proves your positions wrong.

Attached Image (click to enlarge)
Click to Enlarge

Name: 122713 gj h4 stacking.png
Size: 44 KB

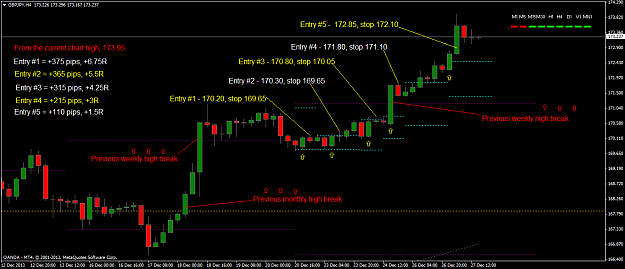
Here is a more detailed look at stacking on the H4 chart, same pair. Entries and exits were rounded to the nearest 5 pips for ease of example's sake. All signals closed up on their respective opens, and all triggered on the next bar. There would be no reason to exit any of these positions yet.

Not every engulfing bar in line with daily trend will provide stacking opportunities like this. Some will be stopped out. Some will be flatted. This is what it's supposed to look like when you're doing it right. Ultimately the market will dictate the frequency and length of the signals. The best we can do is consistently put ourselves on the right side of the probabilities.

One very important thing to note in the second screenshot example. Take into context the 'playing field' in which the signals came into being. Price had recently broken previous monthly high, and then consecutively broke previous weekly high two times in a row. Look at the candle that broke monthly high: solid. The candle that broke weekly high the first time: dominant. The candle that broke weekly high the second time: dominant. This market is screaming long at the moment. Context has a huge impact on how a single engulfing bar can be interpreted.

Stack H4 and H1 together at the same time, in the same direction. Be more selective with the H1 signals.

Lastly, just a few short lines to think about from a book called 'Trading in the Zone.'
1. Anything can happen in the market
2. You don't need to know what will happen next to be successful
3. There is a random distribution between wins and losses for a given edge
4. An edge is defined as an indication of a higher probability of one thing happening over another
5. Every moment in the market is unique

Thank you.
  • Post #2
  • Quote
  • Dec 24, 2013 5:48pm Dec 24, 2013 5:48pm
  •  lucariga
  • | Joined Apr 2012 | Status: Member | 571 Posts
Very interesting (and similar to H4 power by 60minutes). I'm in AP3
  • Post #3
  • Quote
  • Dec 24, 2013 6:20pm Dec 24, 2013 6:20pm
  •  phvrud
  • | Joined Jul 2013 | Status: Junior Member | 1 Post
Ap3 could you please share this prev high/low indicator?
  • Post #4
  • Quote
  • Dec 25, 2013 3:33am Dec 25, 2013 3:33am
  •  Ap3
  • Joined Sep 2011 | Status: Member | 145 Posts
Quoting lucariga
Disliked
Very interesting (and similar to H4 power by 60minutes). I'm in AP3
Ignored
Yes I have read some of his Buy/Sell Line thread. It's a very good one, and I recommend it to anyone interested in simple, clean, and profitable trading. I have not had a chance to check the H4 Power out. Did not know there was a new one by him. But I'm sure he will tell you, just as I will, that these are time-tested principles, and they are nothing new. Except maybe a few tweaks here and there to suit the particular trader. I surely can't take credit for the philosophy behind the strategy, but maybe a couple of the particular rules.
  • Post #5
  • Quote
  • Dec 25, 2013 3:39am Dec 25, 2013 3:39am
  •  Ap3
  • Joined Sep 2011 | Status: Member | 145 Posts
Quoting phvrud
Disliked
Ap3 could you please share this prev high/low indicator?
Ignored
Attached File
File Type: mq4 ###Daily-Weekly-Monthly Hi-Low.mq4   20 KB | 3,323 downloads


Attached File
File Type: mq4 multiMeter.mq4   15 KB | 3,112 downloads


All the multi-meter does is show if a current candle is up or down. So you can see what time frames are up or down all in one shot without switching between charts.
1
  • Post #6
  • Quote
  • Dec 25, 2013 6:18am Dec 25, 2013 6:18am
  •  60minuteman
  • | Commercial Member | Joined Feb 2012 | 3,770 Posts
Very nice approach, this will make money, my instant gut instinct would be to look at NOT moving stops so soon and also to explore much much longer holds on these trades.

Good luck and it's nice to see a thread using R/R to secure big profits instead of high win rates.

I imagine the optimum R/R for this kind of strategy will be up above 10/1 R/R and a win rate below 50%, around 35%....
tradewith60
  • Post #7
  • Quote
  • Dec 25, 2013 4:09pm Dec 25, 2013 4:09pm
  •  Ap3
  • Joined Sep 2011 | Status: Member | 145 Posts
Quoting 60minuteman
Disliked
Very nice approach, this will make money, my instant gut instinct would be to look at NOT moving stops so soon and also to explore much much longer holds on these trades.....
Ignored
Thanks 60, it does make money. I hear you on the stops. This is just a rule that has organically evolved into my trading over the years. Let me explain the reasoning.

We are taking engulfing bars, so there is momentum behind the candle, or at least we'd like there to be. Because of this, price should ideally move from entry with momentum. These are the kinds of trades I want to be in. If price is uncertain about its direction after entry, flipping between profit and loss for awhile, I want out. My goal is to get in, reduce risk as quickly as possible, THEN give the trade room to breathe and grow. Don't get me wrong, I flat a TON of trades, but I'm ok with that.

I totally agree with you on RR. The example in post 1 is only a quick reference guide for the entry and exit mechanics. Ideally we're looking to stack multiple positions in the same direction and hold for days or weeks.

Happy holidays everyone.
  • Post #8
  • Quote
  • Dec 25, 2013 4:20pm Dec 25, 2013 4:20pm
  •  60minuteman
  • | Commercial Member | Joined Feb 2012 | 3,770 Posts
Quoting Ap3
Disliked
{quote} Thanks 60, it does make money. I hear you on the stops. This is just a rule that has organically evolved into my trading over the years. Let me explain the reasoning. We are taking engulfing bars, so there is momentum behind the candle, or at least we'd like there to be. Because of this, price should ideally move from entry with momentum. These are the kinds of trades I want to be in. If price is uncertain about its direction after entry, flipping between profit and loss for awhile, I want out. My goal is to get in, reduce risk as quickly...
Ignored
Yes mate, no right or wrong, I know a few traders who want instant momentum or get out and probe again.... good luck for 2014, hope people respect the thread and don't start trying to 'filter out losses'
tradewith60
  • Post #9
  • Quote
  • Dec 25, 2013 4:26pm Dec 25, 2013 4:26pm
  •  insider999
  • | Joined Mar 2013 | Status: Member | 61 Posts
Hello,

How do you define "engulfing"? There sometimes is confusion about this.

Also, point 1 to 7 are relatively simple. But how do you use weekly S/R levels? This is not clear.

If you only buy 4hrs or 1 hr engulfing bars on "up" days, how do you define "day". Days on my charts starts at 19:00EST. What if i get an engulfing 4hre candle at 23:00? I clearly don t have any data on the "new" day as it just started on my chart. Does this still qualify?

How do you get to the 50% chance of success based on 2:1RR ratio. On past experience? On backtesting?

Thanks,

Regards.

Insider
  • Post #10
  • Quote
  • Dec 25, 2013 5:02pm Dec 25, 2013 5:02pm
  •  Ap3
  • Joined Sep 2011 | Status: Member | 145 Posts
Quoting insider999
Disliked
Hello, How do you define "engulfing"? There sometimes is confusion about this. Also, point 1 to 7 are relatively simple. But how do you use weekly S/R levels? This is not clear.
Ignored
1. Open and close engulfs previous open and close

2. Simplicity is the point. You use the weekly levels the same way any other S/R levels are used. Watch to see if and how price reacts around it, and act accordingly. The reasoning behind using only monthly, weekly, daily previous high/low is because there's no guesswork involved. There's nothing subjective about them, and they're basically the same for everyone. They are significant levels to know and help orient yourself in a longer term trend.

3. I've seen this debate over and over in this forum. My short answer: it does not matter. An engulfing bar is an engulfing bar is an engulfing bar, no matter what timezone or chart you are using. It will not make a blip of difference in the long run.

4. I'm saying those are the baseline numbers to shoot for. Like 60mm said, you don't need a 90% win rate. All you need to make money is a slight edge above 50% with 2:1RR. Anything above that just adds to the profits.
  • Post #11
  • Quote
  • Dec 25, 2013 5:18pm Dec 25, 2013 5:18pm
  •  insider999
  • | Joined Mar 2013 | Status: Member | 61 Posts
AP3,

Thanks for the reply but...

3- An engulfing bar is an engulfing bar. Fine. But what about your # 1 and 2 points in your opening post? You say: "only buy on an up day". How do I know it is an up day if the day has just started? Or maybe I should use the weekly chart in that case?

Sorry if it is the same question, but i would like to understand.
  • Post #12
  • Quote
  • Dec 25, 2013 5:24pm Dec 25, 2013 5:24pm
  •  Ap3
  • Joined Sep 2011 | Status: Member | 145 Posts
Quoting insider999
Disliked
AP3, Thanks for the reply but... 3- An engulfing bar is an engulfing bar. Fine. But what about your # 1 and 2 points in your opening post? You say: "only buy on an up day". How do I know it is an up day if the day has just started? Or maybe I should use the weekly chart in that case? Sorry if it is the same question, but i would like to understand.
Ignored
Is there an engulfing bar?

Did that engulfing bar close up or down relative to your daily open?

It is that simple.
  • Post #13
  • Quote
  • Dec 25, 2013 5:59pm Dec 25, 2013 5:59pm
  •  insider999
  • | Joined Mar 2013 | Status: Member | 61 Posts
ok. Thanks.

So basically what you are saying is: buy/sell any 4hre engulfing bar at the break of the high/low of such a bar. Don t buy into resistance and dont sell into support.

One more question. Say you have a stop order at an X price. How long before you abort the potential trade? (If it is not triggered, obviously)

Insider
  • Post #14
  • Quote
  • Edited Dec 26, 2013 4:12pm Dec 25, 2013 6:16pm | Edited Dec 26, 2013 4:12pm
  •  Ap3
  • Joined Sep 2011 | Status: Member | 145 Posts
Quoting insider999
Disliked
ok. Thanks. So basically what you are saying is: buy/sell any 4hre engulfing bar at the break of the high/low of such a bar. Don t buy into resistance and dont sell into support. One more question. Say you have a stop order at an X price. How long before you abort the potential trade? (If it is not triggered, obviously) Insider
Ignored
Yes, that is basically what I'm saying. No need to over-think things. All we need to do is nudge the 50% probability in our favor. We do so by going with the direction of the daily flow, waiting for a strong momentum signal, and a break of that signal in the same direction. That's it, that's all. The rest are details.

Good question. The trade must trigger on the next candle after the engulfing bar, or it is cancelled. But, a clean 2-bar engulfing works too.
  • Post #15
  • Quote
  • Dec 25, 2013 6:23pm Dec 25, 2013 6:23pm
  •  MCRotter
  • | Joined Dec 2013 | Status: Adapt | 279 Posts
I like it.

The indicator is a bit cluttered, unfortunately I don't have the skills to amend it, but it overall it looks good and I expect it work over the long term
  • Post #16
  • Quote
  • Dec 25, 2013 8:05pm Dec 25, 2013 8:05pm
  •  Ap3
  • Joined Sep 2011 | Status: Member | 145 Posts
Quoting MCRotter
Disliked
I like it. The indicator is a bit cluttered, unfortunately I don't have the skills to amend it, but it overall it looks good and I expect it work over the long term
Ignored
You don't 'need' the indicator. These levels are easily identifiable and require no discretion. They take but a few minutes to go through and draw them for multiple pairs. In fact, if you consider yourself newer in the game, I would strongly suggest you do manually draw them for awhile. This will greatly focus your attention on the overall big picture, and put your signals into better context. You will start to internalize and see price in relation to the bigger picture, and signals in relation to price. Then after awhile you won't need to draw them anymore, and you will just trade them second nature.

But yes, I agree, it is a very cluttered indi from the start. Here's what I did:

1. Turn previous monthly, weekly, daily high/low to TRUE, pick your colors
2. Turn everything else to FALSE, and all other colors black (or whatever color background your chart is)
3. Turn 'Count Days' to 1, to de-clutter
  • Post #17
  • Quote
  • Dec 25, 2013 8:50pm Dec 25, 2013 8:50pm
  •  MCRotter
  • | Joined Dec 2013 | Status: Adapt | 279 Posts
Quoting Ap3
Disliked
{quote} You don't 'need' the indicator. These levels are easily identifiable and require no discretion. They take but a few minutes to go through and draw them for multiple pairs. In fact, if you consider yourself newer in the game, I would strongly suggest you do manually draw them for awhile. This will greatly focus your attention on the overall big picture, and put your signals into better context. You will start to internalize and see price in relation to the bigger picture, and signals in relation to price. Then after awhile you won't need...
Ignored
I actually used to draw these levels on myself, and wait for PA confirmation at those levels before entering - it was a good strategy but unfortunately I can't be around my computer to wait for PA confirmation any more.

I like the indicator generally, and think having the count back for 3 days is a good thing. It might just be my eye (I'm getting older), but I have a hard time pick out the lines with the writing and colours placed as they are.

Will play around with settings as you suggest. Good addition to my indicator list, cheers.
  • Post #18
  • Quote
  • Dec 25, 2013 10:50pm Dec 25, 2013 10:50pm
  •  faststare08
  • | Commercial Member | Joined Jan 2013 | 224 Posts
how do you consider an Up or Down day? close to close basis or breaking the previous high/low? sorry for my noobish question. >.<
  • Post #19
  • Quote
  • Dec 26, 2013 1:31am Dec 26, 2013 1:31am
  •  Ap3
  • Joined Sep 2011 | Status: Member | 145 Posts
Quoting faststare08
Disliked
how do you consider an Up or Down day? close to close basis or breaking the previous high/low? sorry for my noobish question. >.<
Ignored
Please see Post #12. Up or down relative to the day's open. But, if price is above previous day's high AND above daily open, that is extra confirmation of direction. Or the opposite, below yesterday's low AND below daily open.
  • Post #20
  • Quote
  • Dec 26, 2013 2:03am Dec 26, 2013 2:03am
  •  Ap3
  • Joined Sep 2011 | Status: Member | 145 Posts
Quoting 60minuteman
Disliked
{quote} Yes mate, no right or wrong, I know a few traders who want instant momentum or get out and probe again.... good luck for 2014, hope people respect the thread and don't start trying to 'filter out losses'
Ignored
Yes, that's exactly the way I view a trade. As a little probe, an experiment, a seed. A single trade is not a win or lose situation. The win or lose situation is your bottom line at the end of the week, month, and year.

Thank you for the kind words and same to you.
  • Trading Systems
  • /
  • Simple, Non-subjective, Consistent, Effective
  • Reply to Thread
    • Page 1 23456 33
    • Page 1 234 33
0 traders viewing now
  • More
Top of Page
  • Facebook
  • Twitter
About FF
  • Mission
  • Products
  • User Guide
  • Media Kit
  • Blog
  • Contact
FF Products
  • Forums
  • Trades
  • Calendar
  • News
  • Market
  • Brokers
  • Trade Explorer
FF Website
  • Homepage
  • Search
  • Members
  • Report a Bug
Follow FF
  • Facebook
  • Twitter

FF Sister Sites:

  • Metals Mine
  • Energy EXCH
  • Crypto Craft

Forex Factory® is a brand of Fair Economy, Inc.

Terms of Service / ©2021