• Home
  • Forums
  • Trades
  • News
  • Calendar
  • Market
  • Brokers
  • Login
  • Join
  • 12:47am
Menu
  • Forums
  • Trades
  • News
  • Calendar
  • Market
  • Brokers
  • Login
  • Join
  • 12:47am
Sister Sites
  • Metals Mine
  • Energy EXCH
  • Crypto Craft

Options

Bookmark Thread

First Page First Unread Last Page Last Post

Print Thread

Similar Threads

lets develop a system which is very very simple but effective. 7 replies

Simple yet effective strategy (breakdown) 0 replies

Is there any scalping strategy which is simple AND effective? 16 replies

Simple but effective EA 6 replies

Simple yet effective Scalping EA – Does it Exist? 8 replies

  • Rookie Talk
  • /
  • Reply to Thread
  • Subscribe
  • 4
Attachments: my Anytimeframe but made for scalping simple yet effective supermethod
Exit Attachments
Tags: my Anytimeframe but made for scalping simple yet effective supermethod
Cancel

my Anytimeframe but made for scalping simple yet effective supermethod

  • Post #1
  • Quote
  • First Post: May 16, 2008 1:26pm May 16, 2008 1:26pm
  •  nikolaou
  • | Joined Apr 2008 | Status: your mom | 141 Posts
hello. this is my method. only two indicators are used. they are:

1) a version for the awsome oscillator this is edited to be able to change the inputs, the inputs for this system are 2 and 15

2) a version of "The Traders Dynamic Index" [TDI] with a extra line added, which is TEALISH/BLUEISH, i cant rememeber how it is calculated.

i willl post both indicators.

i usually trade this method on the 5min timeframe, however it is effective on all i have tried.

LONG/SHORT CRITERIA:

when AO crosses over centre line at the same time GREEN line of TDI crosses over YELLOW go long.

Vice versa for short.

STOP LOSS:

usually what i do for stoploss is as it is moving twords breakeven i keep the SL 4/5 pips away and once it gets to +4 pips i break even. then when it hits +5 i set the stoploss to +1.

when my position is it +10 pips i set it the stoploss to 8 pips away, and leave it here untill my position is at +15 pips, i think set a trailing stop to the minimum which is +15 pips. and leave it. but if it starts to fall and reaches only positive 5 pips i will close position so that i atleast get something, but once my position is at +20 i dont have to worry about this anymore.

IF BEFORE STOPLOSS IS REACHED THE GREEN LINE CROSSES OVER THE TEAL LINE THEN I CLOSE THE POSITION.

ADVANCED ENTRY:

sometimes you will notice that you get a signal from the TDI before the AO crosses the Centreline, if the AO is moving twords the Centreline and you have been getting several RED bars [when the TDI signal is for a short] i will open a short trade as soon as the TDI signal is given, and treat it as a normal trade.


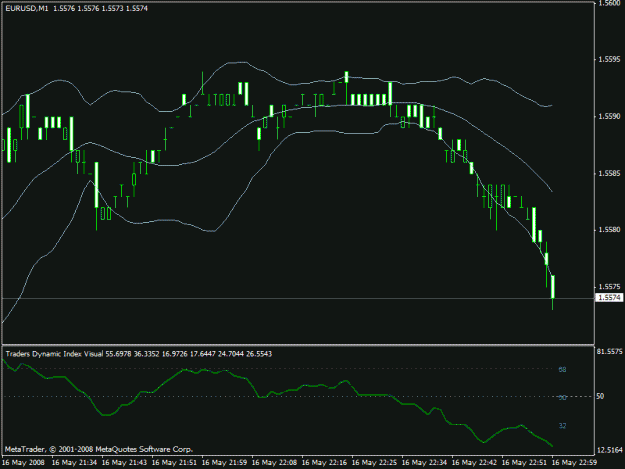
i have posted an example of some trades.

the lines are just to show how the signals line up with the bars and the bar that i actually entered on will have a box underneath it or above it [it doesnt make a difference it the box is above or below it.] green box for long, red for short and i have a white box for exit.

on the last position i opened using the advanced entry.

p.s sorry for how i had to cut out the picture. it was too big and i didnt now how to make it small any other way LOLOLOLOL

Attached Image
Attached File(s)
File Type: ex4 AOwInputs.ex4   3 KB | 1,004 downloads
File Type: mq4 Traders Dynamic Index VISUAL ALERTS.mq4   19 KB | 1,052 downloads
  • Post #2
  • Quote
  • May 16, 2008 1:53pm May 16, 2008 1:53pm
  •  billbss
  • Joined Apr 2006 | Status: Member | 4,301 Posts
Quote
Disliked
when AO crosses over centre line at the same time GREEN line of TDI crosses over YELLOW go long.

Vice versa for short.

Does this mean the crossings have to be at exactly the same bar?
Thanks
 
 
  • Post #3
  • Quote
  • May 16, 2008 3:21pm May 16, 2008 3:21pm
  •  Craig
  • Joined Feb 2006 | Status: Blah blah blah | 1,410 Posts
That chart looks like a game of space invaders, do you have any statistics to back up calling this a 'super method'?
The breaking of a wave cannot explain the whole sea.
 
 
  • Post #4
  • Quote
  • May 16, 2008 3:29pm May 16, 2008 3:29pm
  •  Why Oh Why
  • | Commercial Member | Joined Sep 2006 | 1,911 Posts
Quoting Craig
Disliked
That chart looks like a game of space invaders, do you have any statistics to back up calling this a 'super method'?
Ignored
Do not focus on making money; focus on protecting what you have.
 
 
  • Post #5
  • Quote
  • May 16, 2008 4:05pm May 16, 2008 4:05pm
  •  nikolaou
  • | Joined Apr 2008 | Status: your mom | 141 Posts
no the crosses dont have to be at the exact same time.

when one happens you wait for the other, but if you read the advanced entry part, if you had the TDI cross you dont have to wait for the AO if the conditions are met.
 
 
  • Post #6
  • Quote
  • May 16, 2008 4:10pm May 16, 2008 4:10pm
  •  turtlefan
  • | Joined Apr 2008 | Status: Slow and steady wins the race... | 545 Posts
Interesting system, Nikolaou. Thanks for sharing it.

Seems pretty straightforward to follow, though I get a little cross-eyed looking at all those colored lines at the bottom.

Some basic questions when you get a chance:

1) How profitable is it? Win/loss ratio? Drawdowns? How long have you traded it?

2) Is this intended for one pair in particular or any and all?

3) Do you wait to take entries at the close of the candle or as soon as lines touch?

Thanks!

Scott
Prices are never too high to begin buying or too low to begin selling.
 
 
  • Post #7
  • Quote
  • May 17, 2008 1:06am May 17, 2008 1:06am
  •  nikolaou
  • | Joined Apr 2008 | Status: your mom | 141 Posts
hey thanks,

I dont really have and quantitative statistics on this system, other then the fact that i have been trading it for a month mostly on the 5M timeframe and have been having good results on all pairs i have tried [have mostly used eur/usd, usd/jpy, eur/jpy, eur/chf].

it is most successful when the liquidity for the particular pair being traded is high; my favorite pair to trade is eur/jpy after 3am est (Eastern Standard Time) usually. but i usually start around 1am est, and Eur/usd is good up untill around 1ish pm est.

if i get a long or short signal on a bar i usually wait for the last 10-20 seconds of the bar, or just wait till it closes.

and for your comment about looking at the lines, you can take all of them off and just keep the green and yellow lines, but i prefer to keep them because i have been using the TDI for a while and each lines tell you something about price action; for example: the blue lines are volatility bands, but they arent bollinger bands.

if anyone has any questions or comments or ideas for improvements, fell free to speakita your mindita
 
 
  • Post #8
  • Quote
  • May 17, 2008 2:14am May 17, 2008 2:14am
  •  turtlefan
  • | Joined Apr 2008 | Status: Slow and steady wins the race... | 545 Posts
Thanks, Nikolaou.

Have you been trading it live or with a demo acct.? About how many signals do you average per day? And on average how many pips are you netting each week?

Take care,

Scott
Prices are never too high to begin buying or too low to begin selling.
 
 
  • Post #9
  • Quote
  • Edited 3:46am May 17, 2008 3:02am | Edited 3:46am
  •  shakin23
  • | Joined Sep 2007 | Status: Member | 17 Posts
Why not consider only green line crossing 50 line ? Your eyes would then rest, it's quite similar to all together on the chart
Attached Image (click to enlarge)
Click to Enlarge

Name: eu.gif
Size: 15 KB
 
 
  • Post #10
  • Quote
  • May 19, 2008 12:55pm May 19, 2008 12:55pm
  •  nikolaou
  • | Joined Apr 2008 | Status: your mom | 141 Posts
sorry for bumping thread i was away for the weekend.

using this system on the 5min in at say 11am EST, or earlier on the eur/usd. i can get usually about 2-4 signals an hour, sometimes more sometimes less.

i have not actually added up howmany pips i average a week, but i will be sure to do so this week and post the results.

and to the guy who said why not just use the cross of the green over the 50...

well the method i am using [green crossing yellow] has been very successful for me, because the yellow is a representation of the underlying trend of the market, and the green cross of it is a signal for a trend reversal.

as i said earlier all of these lines in the TDI represent some part of price action and that is the reason i choose to keep them, but you could trade this system just as well if you took out all the lines except green and yellow.


-alex
 
 
  • Post #11
  • Quote
  • May 19, 2008 1:34pm May 19, 2008 1:34pm
  •  lcfxtrader
  • | Commercial Member | Joined Jan 2007 | 460 Posts
The TDI from the Synergy system is one of my favorite indicators. Have you tried adding a price action channel to your chart? If so, care to share your thoughts?
 
 
  • Post #12
  • Quote
  • May 19, 2008 1:50pm May 19, 2008 1:50pm
  •  Andy B
  • | Joined Apr 2008 | Status: Member | 282 Posts
Quoting lcfxtrader
Disliked
The TDI from the Synergy system is one of my favorite indicators. Have you tried adding a price action channel to your chart? If so, care to share your thoughts?
Ignored
I like the look of the TDI and PAC as well, I have been using them today with Imran's Laguerre method.

Do you use any of the Advanced Synergy indicators (Continuation, Range Factor etc) or is it necessary to attend of their seminars to get these?

Andy
 
 
  • Post #13
  • Quote
  • May 19, 2008 3:16pm May 19, 2008 3:16pm
  •  lcfxtrader
  • | Commercial Member | Joined Jan 2007 | 460 Posts
I am using the standard setup. The less indicators, the better imho. I believe the advance indiactors are not free. You can contact compass to see how these are attainable.
 
 
  • Post #14
  • Quote
  • May 19, 2008 3:53pm May 19, 2008 3:53pm
  •  Andy B
  • | Joined Apr 2008 | Status: Member | 282 Posts
Quoting lcfxtrader
Disliked
I am using the standard setup. The less indicators, the better imho. I believe the advance indiactors are not free. You can contact compass to see how these are attainable.
Ignored
I have emailed them a couple of times but with no response unfortunately
 
 
  • Post #15
  • Quote
  • May 19, 2008 4:06pm May 19, 2008 4:06pm
  •  nikolaou
  • | Joined Apr 2008 | Status: your mom | 141 Posts
Quoting lcfxtrader
Disliked
Have you tried adding a price action channel to your chart? If so, care to share your thoughts?
Ignored

i acutally recently did so, to great success , i added a line in the middle of the PAC to signal exits.
 
 
  • Post #16
  • Quote
  • May 19, 2008 8:41pm May 19, 2008 8:41pm
  •  clockwork71
  • | Commercial Member | Joined May 2007 | 7,602 Posts
Quoting Craig
Disliked
That chart looks like a game of space invaders, do you have any statistics to back up calling this a 'super method'?
Ignored
Space Invaders was the shizzle. I have it on my phone!
 
 
  • Post #17
  • Quote
  • Sep 23, 2008 11:30am Sep 23, 2008 11:30am
  •  Pipologist99
  • | Joined Aug 2008 | Status: Member | 110 Posts
Guys, let's revive this thread to discuss the Basic and Advanced Synergy methods...Who's with me?????
 
 
  • Post #18
  • Quote
  • Last Post: Oct 4, 2008 4:12am Oct 4, 2008 4:12am
  •  vladv
  • | Joined Mar 2006 | Status: Mr. | 203 Posts
Thanks for sharing it,I will test on my demo account!

http://www.forexfactory.com/images/misc/progress.gif


  • Rookie Talk
  • /
  • my Anytimeframe but made for scalping simple yet effective supermethod
  • Reply to Thread
0 traders viewing now
Top of Page
  • Facebook
  • Twitter
About FF
  • Mission
  • Products
  • User Guide
  • Media Kit
  • Blog
  • Contact
FF Products
  • Forums
  • Trades
  • Calendar
  • News
  • Market
  • Brokers
  • Trade Explorer
FF Website
  • Homepage
  • Search
  • Members
  • Report a Bug
Follow FF
  • Facebook
  • Twitter

FF Sister Sites:

  • Metals Mine
  • Energy EXCH
  • Crypto Craft

Forex Factory® is a brand of Fair Economy, Inc.

Terms of Service / ©2023