Gold drops further, breaking 2007 year end close and also 2007 peak, sending dollar into a bull run.
With 4967 taken out, it becomes resistance now.
Phil your comments are awaited.
Ignored
In the 3+ years I've been on this forum I have never once given my opinion on the market. The truth is, I spend no time thinking about it and have no opinion whatsoever. I find the opinions offered here to be random guesses and I look at them for entertainment value only.
Who cares where gold closed in 2007? Did you think number had some magical powers? The dollar was gaining strength before today. Do you really think 4967 is now resistance? How does that make you a better trader? Will you make future trading decisions off of that number?
I am not trying to be an ass but I do know it sort of sounds that way. I just don't think much of what is said here actually matters. When it comes to market opinoins I have no respect for what others think and, as a consequence, I reasonably assume that they would care less about mine.
Ignored
I think this is the best statement I have read yet here at the factory. I believe you have to be absolutely unbiased to be able trade effectively, while I have not fully attained the state of mind, I'm gaining on it.
I don't know why people have to complicate things so much, ego I guess, but trading is best when simple and boring.
Just my two pips.
Joined Aug 2007
|
Status: The Weather Man
|8,859 Posts
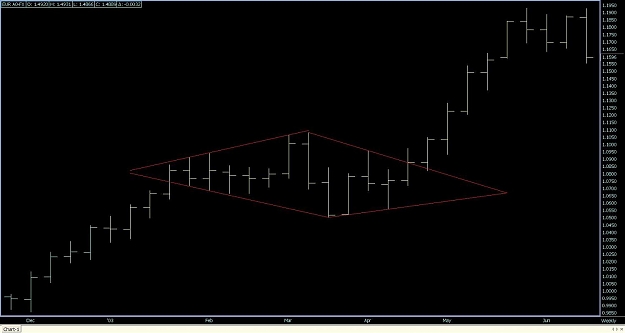
here's a simple 4h chart.
price is wayyyyy oversold, reached 161.8 extension successfully, 4h and daily doji/pinbar, and a nice diamond reversal pattern on 4h. all these lead to 2 scenarios..
1) a retracement to 1.510x as a first target then 1.530x as a second target.
2) a complete reversal.
In this particular case the diamond has about 90% probability to be a continuation pattern. So, 1.4650-70 is the most likely target before the end of the week.
In this particular case the diamond has about 90% probability to be a continuation pattern. So, 1.4650-70 is the most likely target before the end of the week.
Ignored
There is no such thing as a diamond continuation pattern...until today. You should give your creation a name.
In this particular case the diamond has about 90% probability to be a continuation pattern. So, 1.4650-70 is the most likely target before the end of the week.
Ignored
that might be true... especially considering the strength of this bear. each time it starts going up, lower TFs rush to over bought levels, this signals more consolidation.
i am for a retracement at the moment, i believe price needs to gain more selling power to break through. this doesn't rule out the possibility of this going down right after consolidation. i believe if we don't get a retracement today, down we go tomorrow
this is very similar to PA back in the end of feb start of march of this year. price consolidated and resumed it's uptrend. the only difference is that the current level of price has a S/R history.
I'm having a hard time getting those diamonds correctly.
Welcome to trading room btw
Ignored
Thanks, but I feel more comfortable in my own thread "cave". Explaining some common knowledge stuff to those cocky youngsters seems like a waste of time.
Thanks, but I feel more comfortable in my own thread "cave".
Ignored
I agree with this line of thought.
Lately(last, oh, 12+ months) it seems just about ANYONE who has even a fidget of clue and dares poke their head "outside" at all, simply gets snapped and shot at on FF, leading to some people(imho rightfully) just thinking "Well, I certainly don't need this and YOU - but some of you could have used some of me".
Disrespect permeates.
I was afraid this would happen and over the years it seems it just gets worse. Maybe I just grew to expect too much of people(taking things serious instead of as a forum game) after seeing how it CAN be different.
Igrok - don't take 'em seriously and keep doing your thing in the usual hangout.
Some things are just not worth bothering about.
Things always feed back. If all you get for trying to help or participate is negativity or instant dismissal, then that simply ceases. We all get what we want out of things, and if people prefer FunFactory(some posts are strongly reminiscent of a day in Kindergarten rather than of a professional exchange of opinion) instead of ForexFactory that's what they will create.
And if the only reward for effort is ridicule, well, there's not as big a required masochist around who'll go for that long term.
It sometimes seems we progressively and consistently work towards kicking out those that actually have items of value, but can't stop growing the numbers of those with "gimme gimme" attitudes, "kewl" posts, mighty morphing troll powers and immense prowess...on demo.
IMHO that's neither in the spirit of a topic oriented forum(FF in general), nor in the spirit of something that's ironically even supposed to be it's upper echelon(1kT).
It's more than a bit...ridiculous at times.
Especially when I read that some folks don't even care to even try to post here anymore because they know the type of responses they will get about something they've done for a living for x years now.
Again - we'll get what we ask for with our behavior in toto.
This is the most obvious "continuation diamond" example on the weekly EUR/USD chart that even a complete TA idiot must be able to identify correctly.
Ignored
What criteria do you use to distinguish between a diamond top/bottom and a diamond continuation?
The Encyclopedia of Chart Patterns has research that shows 73% of all diamonds reverse and reach their profit target. That would mean that only 27% of diamonds are what you would call continuations. Why would anyone trade a pattern that in only 27% accurate?
Ignored
I'm sorry, but since we are calling BS, it's only fair that I point out the "Encyclopedia of Chart patterns" sounds like it's talking out of its butt. I don't have the book so bear with me: Are they trying to say that there is ANYTHING (let alone something with a cool name like diamond) that repeats itself with 73% accuracy, and without violating this "pattern" on which it is based before hitting it's "targets"? What are these profit targets? Are they significant?
There is no peer-reviewed statistical evidence, anywhere in academia or the public domain, that demonstrates patterns doing anything above 50% or so in robust predictive accuracy. Robust meaning verifiable by pattern matching (patterns that are violated then ultimately met "later" are not verifiable or testable).
Otherwise we could all retire in three months at the most. You obviously know this.. I'm only pointing out that your quote sounded very misleading.
Virtue finds and chooses the mean.
Aristotle, Ethica Nichomachea
What criteria do you use to distinguish between a diamond top/bottom and a diamond continuation?
The Encyclopedia of Chart Patterns has research that shows 73% of all diamonds reverse and reach their profit target. That would mean that only 27% of diamonds are what you would call continuations. Why would anyone trade a pattern that in only 27% accurate?
Ignored
There're a lot of misconceptions over technical issues even in the most respected TA sources. I have found enough of critical mistakes even in some classic TA books like John Murphy's, for example. I have been conducting my own research for over 15 years and had discovered a lot of new and interesting stuff never mentioned anywhere else. That includes some foundings regarding the diamonds that do not correspond with that BS encyclopedia concept whatsoever.