• Home
  • Forums
  • Trades
  • News
  • Calendar
  • Market
  • Brokers
  • Login
  • Join
  • User/Email: Password:
  • 1:43pm
Menu
  • Forums
  • Trades
  • News
  • Calendar
  • Market
  • Brokers
  • Login
  • Join
  • 1:43pm
Sister Sites
  • Metals Mine
  • Energy EXCH
  • Crypto Craft

Options

Bookmark Thread

First Page First Unread Last Page Last Post

Print Thread

Similar Threads

USD/JPY Trading Room 34 replies

EUR/GBP Trading Room 374 replies

long eur/jpy, gbp/jpy, usd/jpy 11 replies

EUR/USD Trading Room 328 replies

eur/usd, eur/jpy, usd/jpy average 0 replies

  • Interactive Trading
  • /
  • Reply to Thread
  • Subscribe
  • 215
Attachments: EUR/JPY Trading Room
Exit Attachments
Tags: EUR/JPY Trading Room
Cancel

EUR/JPY Trading Room

  • Last Post
  •  
  • Page 1 23456 44
  • Page 1 234 44
  •  
  • Post #1
  • Quote
  • First Post: Sep 9, 2007 3:40am Sep 9, 2007 3:40am
  •  kharvell
  • Joined Dec 2006 | Status: call me Kevin | 1,263 Posts
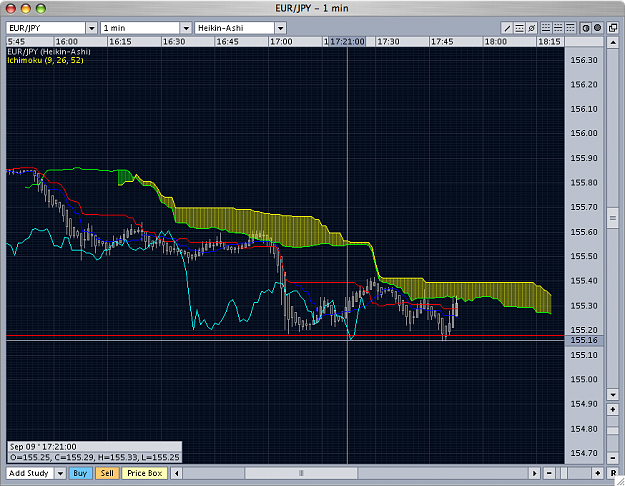
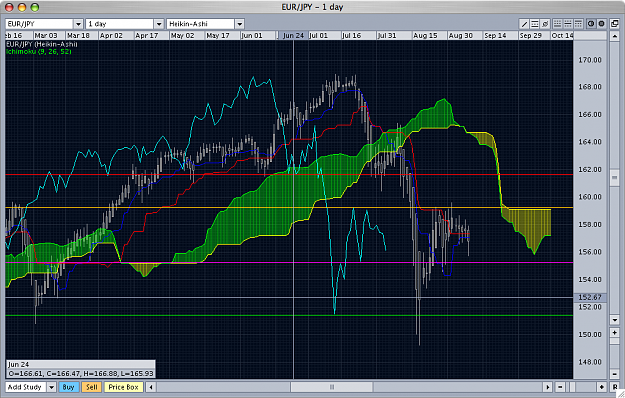
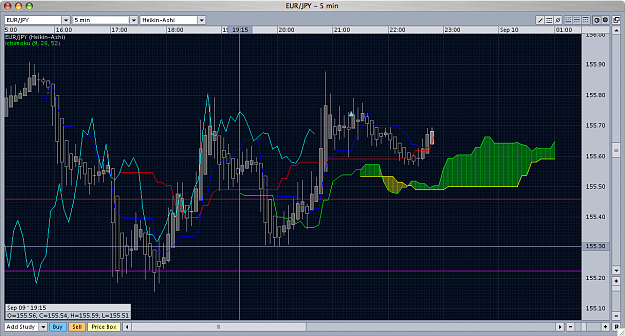
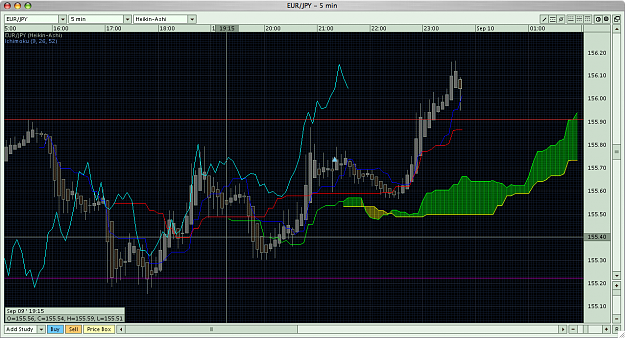
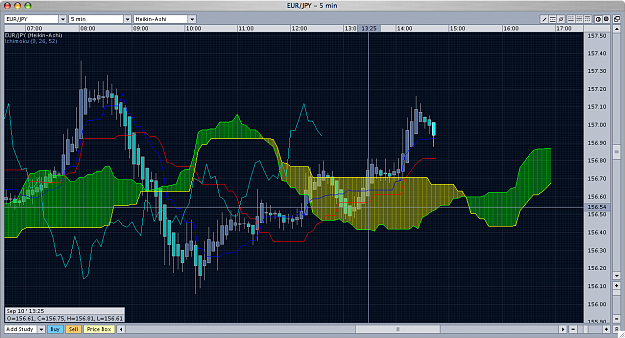
Long-term and short-term analysis of EUR/JPY. Please explain what you feel EUR/JPY will do in the not so distant future..
  • Post #2
  • Quote
  • Sep 9, 2007 3:54am Sep 9, 2007 3:54am
  •  kharvell
  • Joined Dec 2006 | Status: call me Kevin | 1,263 Posts
Overall, I am leaning towards shorts when looking at my daily ichimoku kinko hyo.

Reasons for this:


  1. Kumo is now and in the future bearish(yellow cloud)
  2. Kumo cloud in the future has formed a flat upper top, indicating resistance at around 159.13
  3. Chikou Span(the laggin Light Blue line) is showing support and resistance at the yellow horizontal lines which support Kumo Resistance of 159.13, however, I want to see the other support I've indicated(155.17) broken(which I forsee happening..and we may expect to see 151.39 if 155.17 then 154.00 is broken.
  4. Chikou Span(the lagging Light Blue line) is below price, indicating bears.
  5. Price just fell below the Kijun-sen(Red line) and Tenkan-sen(Blue line).


I think that about covers it.

Attached Image (click to enlarge)
Click to Enlarge

Name: Screenshot_2.png
Size: 43 KB
 
 
  • Post #3
  • Quote
  • Sep 9, 2007 6:53pm Sep 9, 2007 6:53pm
  •  kharvell
  • Joined Dec 2006 | Status: call me Kevin | 1,263 Posts
Quoting kharvell
Disliked

  1. Chikou Span(the laggin Light Blue line) is showing support and resistance at the yellow horizontal lines which support Kumo Resistance of 159.13, however, I want to see the other support I've indicated(155.17) broken(which I forsee happening..and we may expect to see 151.39 if 155.17 then 154.00 is broken.

Ignored
155.17 is holding out for now. I think the gap may be filled before it heads down seriously, but I am keeping my eye on 155.17 for now(Red horizontal line below).
Attached Image (click to enlarge)
Click to Enlarge

Name: Screenshot_3.png
Size: 53 KB
 
 
  • Post #4
  • Quote
  • Sep 9, 2007 7:26pm Sep 9, 2007 7:26pm
  •  monarch
  • | Joined Aug 2006 | Status: Member | 3,126 Posts
8-29-07 we were at 154.53 low, and high at 159.60.

We have cleared all levels of the Fibo's with the 76.4 cleared on Friday.

I expect a test of this low at 154.53, then possibly a move down towards 153.32 this week, finding a range between 153.50 and 155.50 before the Rate decision.

On a larger scale, the low at 149.24 up to 159.66 finds us at the break of the 38.2% for the second time, this would send us to the 50% test agian at 154.45 or if we find support we could move up to re-test the 23.6% at 157.20.

If we break below the 50% at 154.45, the next level down is the 61.8% at 153.22.

I will wait to see where we head once we get the Gap Fill from the Sunday Open, since this is only a Fibo analysis.

Keep up the thread bro.

Ken
 
 
  • Post #5
  • Quote
  • Sep 9, 2007 9:39pm Sep 9, 2007 9:39pm
  •  HalifaxCB
  • | Joined Apr 2007 | Status: Ich habe genug | 551 Posts
Well, for my first post here I might as well get the worst over and make a fool of myself
The brief part - I am still looking for the pair to get down into the mid 140's. Whether that is do-able given the expected stiffening resistance expected once USD/JPY crosses 110 remains to be seen; if Eur/Usd starts heading to 140, then it'll require a rethink, to say the least (145 would require eur/usd at 1.32 if USD/JPY can be held at 110 by the MoF/BoJ ; if the USD/JPY can be pushed down to the 105 level then Eur/Usd can pretty much stay where it is). Right now my primary guidance is coming off the trendline from the last little high before the fall and the height of the first bounce (in the charts below), supplemented by a LSQ 1 STD channel from the last little high

A peculiar technical aspect....

One of the things that fascinates me is what is known in modelling as "regime changes"; where the behaviour of the market (in this case) changes suddenly, sometimes for the better, sometimes for the worse. In ASW it's rather like the analysis of "track segmentation" for evasive targets; it's similar to the "punctuated equilibrium" aspect of evolutionary theory. Except that in ccy pairs the punctuation can as easily lead back to a longer term regime as to a newer one. (It's also similar to the little musical jokes played by Beethoven and Mozart, but that's wandering too far afield..)

In the Eur/JPY, I noticed (looking at the weeklies) a number of areas where the behaviour - in terms of the trend rate and the wavelength of variance - a number of segments - where behaviour seems consistent for awhile, and then shifts into another regime. Several primary ones are shown on the first plot, as short trendlines with one std plotted alongside.

The curious thing is what happens when one extends these; they seem to provide good guidance w/r to the current plunge. The results are shown in the second plot. I've attached these rather than included them, hopefully they won't be too wide.

And it all may be just coincidence....
Attached Image(s) (click to enlarge)
Click to Enlarge

Name: eurjpy_20070910a.gif
Size: 19 KB
Click to Enlarge

Name: eurjpy_20070910b.gif
Size: 21 KB
 
 
  • Post #6
  • Quote
  • Sep 9, 2007 10:38pm Sep 9, 2007 10:38pm
  •  kharvell
  • Joined Dec 2006 | Status: call me Kevin | 1,263 Posts
Thanks for your analysis guys!

Ken,

I personally don't use fibs, but I appreciate hearing your input. Please continue to update us as you see fit.

Thanks,

Kevin


Halifax,

Interesting chart... And no need to post a disclaimer about you being wrong. We could all be wrong. Losing is OK with me, are you ok with it?

I do think 140 is pretty extreme, unless you mean 145 by mid 140's, which PERSONALLY I still think is a bit liberal. UNLESS, strong support at 151.38 is broken(Indicated below in green horizontal line), I'm not going to be so quick to say short. You may be right, but for now, I'm going to see what happens when/if it gets to 151.38.

I derived the 151.38 from the Chikou Span which is the light blue line, and where it reached a support point(where it touches the green horizontal support line) creating a trough.

Appreciate your analysis Keep it up!
Attached Image (click to enlarge)
Click to Enlarge

Name: Screenshot_4.png
Size: 74 KB
 
 
  • Post #7
  • Quote
  • Sep 9, 2007 11:13pm Sep 9, 2007 11:13pm
  •  HalifaxCB
  • | Joined Apr 2007 | Status: Ich habe genug | 551 Posts
Of course it's a bit liberal, I'm Canadian But 147 by the end of October would be pleasant enough .....
But yes it is extreme, so it's basically one step at a time, there's a number of key support points to get through, particularly those set by daily lows over thelast month, and the Feb/March low..
 
 
  • Post #8
  • Quote
  • Edited Sep 10, 2007 1:07am Sep 9, 2007 11:47pm | Edited Sep 10, 2007 1:07am
  •  kharvell
  • Joined Dec 2006 | Status: call me Kevin | 1,263 Posts
Quoting HalifaxCB
Disliked
Of course it's a bit liberal, I'm Canadian But 147 by the end of October would be pleasant enough .....
But yes it is extreme, so it's basically one step at a time, there's a number of key support points to get through, particularly those set by daily lows over thelast month, and the Feb/March low..
Ignored
I wish you luck, I'll probably be with you, but I like to see it first before I believe it.

As for now, it looks to be a decent time to take longs for short-term only. I personally entered a bit too early at 155.75, but expect to make pips in a bit.


  1. Bullish Kumo(green cloud)
  2. Chikou Span(light blue line) above price
  3. Bounce(ish) off the Kijun-sen(Red Line)


EDIT: 2 pips locked in, will let it ride until it says "I'm going down, Kevin", currently up 16

EDIT #2: Here's my chart a couple hours later... I usually move my S/L along with the peaks and valleys of the chikou span(light blue line), and add 4 pips or so just for safety cushion(I like to breathe). I usually get a bunch of small winners, but when I bank, it's pretty good. Right now I'm up 28 pips, with 16 locked in.

LAST EDIT: TRADE stopped out at 156.00 for 25 pips

Attached Image(s) (click to enlarge)
Click to Enlarge

Name: Screenshot_5.png
Size: 61 KB
Click to Enlarge

Name: Screenshot_7.png
Size: 66 KB
 
 
  • Post #9
  • Quote
  • Edited 11:06am Sep 10, 2007 10:48am | Edited 11:06am
  •  FxJarhead
  • | Joined Feb 2007 | Status: Member | 447 Posts
This is a 15 minute FOZZY short / scalp... Turned Day Trade ..... on Euro news, so i went for a larger Target.

More info.....check Fozzy Thread

Those are 3/8/21/ema's

Fxj

P.S. Blacked out Trade number....this trade is on Oanda, only use NF MT4 charts.

Apologies I can't get these posted faster....trading has to come first....EDUCATIONAL ONLY

TRAILING STOP TRIGGERED 1101 am edt at 156.41.....just missed 156.17 by 2 pips twice.... +40

UPDATE: T/S moved to 156.41 @ 1048am edt
EDIT: News reference - Thompson Financial, Trichet at G10, news article release on FF
Attached Image
Proper Prior Planning Prevents Piss Poor Performance
 
 
  • Post #10
  • Quote
  • Sep 10, 2007 11:12am Sep 10, 2007 11:12am
  •  raczekfx
  • | Commercial Member | Joined Oct 2005 | 2,899 Posts
This was my today's short trade on e/j after retracement.
short at 157.20, out on half at 156.80, remainder closed at 156.30
Attached Image
 
 
  • Post #11
  • Quote
  • Edited 11:41am Sep 10, 2007 11:26am | Edited 11:41am
  •  FxJarhead
  • | Joined Feb 2007 | Status: Member | 447 Posts
EUR/JPY TRADE REVIEW

Trailing stop triggered on short from 156.81 @ 156.41 just barely! After 2 tries at 156.17.

Only to see Target @ 156.17 breached about 13 minutes later
( see 5 min close up chart )

Did I move my T/S to close?? It was at 156.51.

Was there a better location...maybe the 21ema area?

I did not have PP's on the chart, came across the set up....Not totally Prepared?

Should I be satisfied that I had read the News article, and checked the eur/jpy...saw the opp. and captured what I did.?

Fxj

P.S. added Horizontal yellow lines to denote trade area, as original disappear when trade was closed. Vertical Lines denote time span of trade.

UPDATE: Just noticed I did not capture the entire pic I thought I had....see post 9 for the 15 min trade. The 5 min only shows the end.....Thought I got it all for a closer look on the 5.
Attached Image
Proper Prior Planning Prevents Piss Poor Performance
 
 
  • Post #12
  • Quote
  • Edited 11:36am Sep 10, 2007 11:33am | Edited 11:36am
  •  FxJarhead
  • | Joined Feb 2007 | Status: Member | 447 Posts
Quoting raczekfx
Disliked
This was my today's short trade on e/j after retracement.
short at 157.20, out on half at 156.80, remainder closed at 156.30
Ignored
NICE WORK....

Why 157.20.... ? Due to the reversal bar (Pin) and doji? (Speaking from my 15 min charts). I'm a bit more visual.

I'd have liked the extra 39 pips!!! LOL

Apologies I did not look at your time frame b4 writing this....

Fxj

UPDATE: I'm Good....saw your chart ( 4hr ) more closely..... shorted the 61.8 with a trendline test, correct?
Proper Prior Planning Prevents Piss Poor Performance
 
 
  • Post #13
  • Quote
  • Sep 10, 2007 11:42am Sep 10, 2007 11:42am
  •  raczekfx
  • | Commercial Member | Joined Oct 2005 | 2,899 Posts
Quoting FxJarhead
Disliked
....

Why 157.20.... ? Due to the reversal bar (Pin) and doji?


UPDATE: I'm Good....saw your chart ( 4hr ) more closely..... shorted the 61.8 with a trendline test, correct?
Ignored
That's right. It was retracement to 61fib and TL confluence after break lower last Friday. There was no doji at the time ...
 
 
  • Post #14
  • Quote
  • Edited 11:58am Sep 10, 2007 11:57am | Edited 11:58am
  •  FxJarhead
  • | Joined Feb 2007 | Status: Member | 447 Posts
Had I used this analysis.....I'd have not shorted til 156.48.

Not saying one is better than other....just maybe one is more prone to a small scalp????????


Raczek...Thanx....No doji on 4hr, I was referring to my 15 min chart.....Though I am glad I could see your logic in your trade by myself. THX again!

Did you by chance have a limit order placed there, or was it a market order you took?

Fxj
Attached Image
Proper Prior Planning Prevents Piss Poor Performance
 
 
  • Post #15
  • Quote
  • Sep 10, 2007 12:04pm Sep 10, 2007 12:04pm
  •  raczekfx
  • | Commercial Member | Joined Oct 2005 | 2,899 Posts
Quoting FxJarhead
Disliked
Had I used this analysis.....I'd have not shorted til 156.48.

Not saying one is better than other....just maybe one is more prone to a small scalp????????


Raczek...Thanx....No doji on 4hr, I was referring to my 15 min chart.....Though I am glad I could see your logic in your trade by myself. THX again!

Did you by chance have a limit order placed there, or was it a market order you took?

Fxj
Ignored
welcome Fxj. no limit, I entered it @ market.
I had a limit buy set for gb/chf (posted in my journal last night) at 2.4010 but it was never triggered.
 
 
  • Post #16
  • Quote
  • Sep 10, 2007 3:44pm Sep 10, 2007 3:44pm
  •  kharvell
  • Joined Dec 2006 | Status: call me Kevin | 1,263 Posts
Nice shorts gentlemen. Jarhead, pips are better than no pips. Enjoying the analysis; feel free to keep it up whenever you can!

For the short-term, I am thinking a Long may be in order with a T/P of ~157.25. I think this is strong resistance here.

Reasons for Long:


  1. Tenkan-Sen above Kijoun-Sen(Blue line above red line)
  2. Green Kumo in the future
  3. Chikou Span above price
  4. Price is above kumo


I will wait for a bounce off either the Kijun-sen(red) or Tenkan-sen(blue).

This opportunity is void if Kijun-sen is broken.

Attached Image (click to enlarge)
Click to Enlarge

Name: Screenshot_9.png
Size: 83 KB
 
 
  • Post #17
  • Quote
  • Sep 10, 2007 4:58pm Sep 10, 2007 4:58pm
  •  boxingislife
  • Joined Jan 2006 | Status: gamblin wit style | 740 Posts
turning point in my opinion
Attached Image
 
 
  • Post #18
  • Quote
  • Sep 10, 2007 5:22pm Sep 10, 2007 5:22pm
  •  mrgreen
  • Joined May 2005 | Status: Member | 1,494 Posts
My approach to this pair is a bit different from whats been posted so far. I don't take many trades any more. The rolling top is one of my favorite formations. I shorted Friday AM and am holding. Something I have learned is that once my capital is protected (i'm at breakeven +16 pips to cover swap) I can wait for the trade to play out. As you can see I got in at what I thought was a bit early on 8/28 - was stopped out at BE + interest covered. 2nd trade. After it went 70 or so pips I figured it would retrace and so took a small profit. On this 3rd trade I believe I am in at the right time and will not be closing until receive a signal that the downtrend is over. (Or I get stopped out again)
Attached Image
In trading, there is no bullshit. You either make money or you don't.
 
 
  • Post #19
  • Quote
  • Edited 2:57am Sep 11, 2007 2:41am | Edited 2:57am
  •  FxJarhead
  • | Joined Feb 2007 | Status: Member | 447 Posts
30 Min Chart
Sell Limit placed at 156.94
Profit Target @ 156.64
Stop Loss @ 157.24

ORDER CANCELLED @ 0254am EDT
Attached Image
Proper Prior Planning Prevents Piss Poor Performance
 
 
  • Post #20
  • Quote
  • Sep 11, 2007 2:56am Sep 11, 2007 2:56am
  •  FxJarhead
  • | Joined Feb 2007 | Status: Member | 447 Posts
Scalp order on post above cancelled.....as you can see by chart....

Close but no cigar!

Fxj
Attached Image
Proper Prior Planning Prevents Piss Poor Performance
 
 
  • Interactive Trading
  • /
  • EUR/JPY Trading Room
  • Reply to Thread
    • Page 1 23456 44
    • Page 1 234 44
0 traders viewing now
  • More
Top of Page
  • Facebook
  • Twitter
About FF
  • Mission
  • Products
  • User Guide
  • Media Kit
  • Blog
  • Contact
FF Products
  • Forums
  • Trades
  • Calendar
  • News
  • Market
  • Brokers
  • Trade Explorer
FF Website
  • Homepage
  • Search
  • Members
  • Report a Bug
Follow FF
  • Facebook
  • Twitter

FF Sister Sites:

  • Metals Mine
  • Energy EXCH
  • Crypto Craft

Forex Factory® is a brand of Fair Economy, Inc.

Terms of Service / ©2023