Welcome everyone who got excited by the thread!
Here we go let me introduce my strategy:
AperyonFX
The main idea:
In most cases there are trends including main and counter trends. These are what I am hunting for finding the best entrance point with the best exit point also the best way to manage the losing ones as well as the protecting the profit I already have achieved.
Timeframe:
Ideally it is H1 not shorter but also keeping an eye on the H4 charts to identify the trends better. It deserves to be mentioned I try to look at the whole trend not just that part of it which is actually on the screen.
Instruments:
The instruments have to be volatile enough also good idea to keep an eye on the ones which them are correlated to. Therefore my choices are:
EUR/USD; USD/JPY; GBP/USD
Trading Times and Trade Lengths:
This strategy can not be called as either scalp, day, intraday nor swing trade strategy.
Some of the trades lasts for less than an hour and so far the longest one was a bit less than 2 days.
Money management:
Lets say I have a capital of $1000. The leverage is 1:50. Lets have EUR/USD as an example further more a main example. The price is 1.35 so the margin it will need is going to be $27 after every 0.01 lot.
The third of the capital (because ideally I will have 3 trades running at a time, one on each instrument) is $333.
To maximalise this $333 I will need 0.12 lot at a 10 pip risk which will cause $324 margin + $12 lost=$336 which is perfectly fine!
Therefore after every $1000 of capital $12 will be risked at every trade which is roughly 1% of the whole capital.
What Am I Doing?
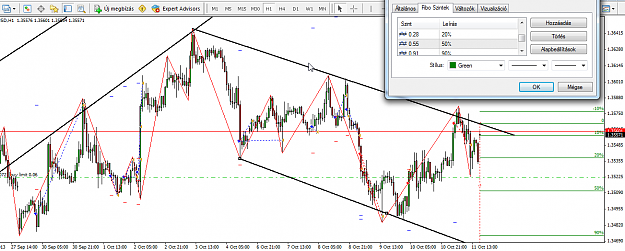
Identify a trend on H1.
Draw the support and resistance lines on the chart. Both of the lines has to be touching at least 2 relevant points such as 2 highs and 2 lows. If the lines are roughly parallels the trade is identified.
I draw my SCALE on and trade as it is described below
My SCALE
The scale looks like this:
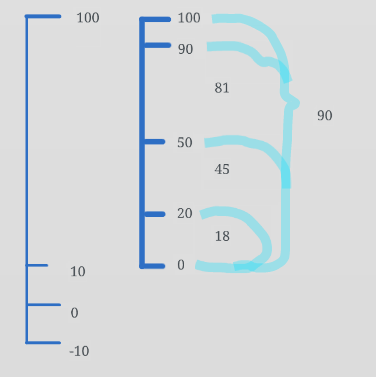
We have a Scale from 0 to 100 with the numbers of -10; 0; 10; 100
0 is where the support line is at the current time and 100 is where the resistance line is at the current time
From 10 to 100 there is an other scale which's length is 90 and on this scale we have a 20%, 50% and 90%
20% is (90*0,2=18 + 10(this is where it all started from)) 28 far from 0
50% is (90*0,5=45 + 10) = 55 far from 0
90% is (90*0,9=81 + 10) = 91 far from 0
How I Use My Scale
A) Once 10% is reached: Open a trade risking $12,5 (after every $1000 of capital at 1:50 leverage(as it was described above))
The bigger the distance is the less lot I open as I stick with the $12,5 to be risked
I set the Stop Loss at -10% so the Risked pip will be 20%
B) If it all goes wrong and and the market goes against me once the set S/L is reached I close 100% of the trade
C) If 20% will be reached I close half of the trade and set S/L to Break Even.
if it all goes down Ill make 45% of the risked money.
D) If 50% will be reached I close the half of the remaining trade so only one quarter will be left open and set S/L to 20%
if all goes wrong at this point Ill make 123,75% of the risked money
E) If 90% will be reached I close the last quarter making 202,5% of the risked money.
If I had 100 trades and every one of the outcomes would happen as often as hard it is to achieve meaning winning 202,5 is twice as hard than losing 100 and winning 45 is bit more than twice as easy than losing a 100 it will come at the total of every trade has a 44,2% portential
IMPORTANT: THE 0->100 DISTANCE HAS TO BE AT LEAST 50 PIP SO THE INITIAL RISKED PIP WILL BE 10PIP AT LEAST!!!
Also i am thinking on starting the trade only once 0 has been touched and went back to 10% again.
If the price passes the support line and goes a bit further my scale will stretch with the the candle (?? as long as if it is a bullish trend the price doesnt go under the previous important low??)
Once the trade has started all the emotions and closed off and there is nothing left to do apart from keeping and eye on what is going on and follow the rules meaning closing parts of the trade and resetting the S/L line.
Here is an example of how this strategy works.
(Please ignore the red dotted lines as not all the trades have been actually traded for certain reason such as I cant watch the market at all times because I have a full time work (12 hours a day) and some lines are not correct because I use mobile app as well and this particular week I closed my 2 running trade in a wrong order from my phone. (meaning 2 trade runs and pending order to close a part of the trade closed the part of the other trade not the one I originally wanted but the result was all the same)
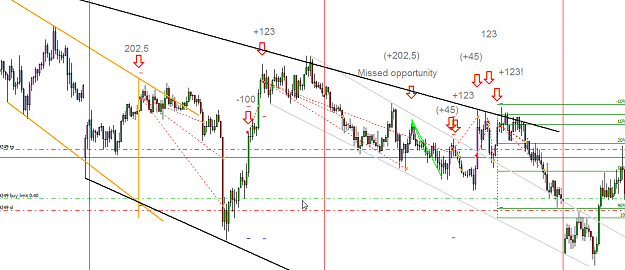
As you can see it works quite fine
What I am asking from all of you who is reading this post is try to tell me:
- How could my entry points be more reliable
- What indicators would you use
- What rules would you add or modify
- Any other idea is welcomed!!
Thank you for reading, I am looking forward to read your comments!
[highlight=rgba(17, 17, 17, 0.901961)]en → hu
azonos
melléknév: azonos, ugyanaz, ugyanilyen
névmás: ugyanaz[/highlight]
Here we go let me introduce my strategy:
AperyonFX
The main idea:
In most cases there are trends including main and counter trends. These are what I am hunting for finding the best entrance point with the best exit point also the best way to manage the losing ones as well as the protecting the profit I already have achieved.
Timeframe:
Ideally it is H1 not shorter but also keeping an eye on the H4 charts to identify the trends better. It deserves to be mentioned I try to look at the whole trend not just that part of it which is actually on the screen.
Instruments:
The instruments have to be volatile enough also good idea to keep an eye on the ones which them are correlated to. Therefore my choices are:
EUR/USD; USD/JPY; GBP/USD
Trading Times and Trade Lengths:
This strategy can not be called as either scalp, day, intraday nor swing trade strategy.
Some of the trades lasts for less than an hour and so far the longest one was a bit less than 2 days.
Money management:
Lets say I have a capital of $1000. The leverage is 1:50. Lets have EUR/USD as an example further more a main example. The price is 1.35 so the margin it will need is going to be $27 after every 0.01 lot.
The third of the capital (because ideally I will have 3 trades running at a time, one on each instrument) is $333.
To maximalise this $333 I will need 0.12 lot at a 10 pip risk which will cause $324 margin + $12 lost=$336 which is perfectly fine!
Therefore after every $1000 of capital $12 will be risked at every trade which is roughly 1% of the whole capital.
What Am I Doing?
Identify a trend on H1.
Draw the support and resistance lines on the chart. Both of the lines has to be touching at least 2 relevant points such as 2 highs and 2 lows. If the lines are roughly parallels the trade is identified.
I draw my SCALE on and trade as it is described below
My SCALE
The scale looks like this:
Attached Image
We have a Scale from 0 to 100 with the numbers of -10; 0; 10; 100
0 is where the support line is at the current time and 100 is where the resistance line is at the current time
From 10 to 100 there is an other scale which's length is 90 and on this scale we have a 20%, 50% and 90%
20% is (90*0,2=18 + 10(this is where it all started from)) 28 far from 0
50% is (90*0,5=45 + 10) = 55 far from 0
90% is (90*0,9=81 + 10) = 91 far from 0
How I Use My Scale
A) Once 10% is reached: Open a trade risking $12,5 (after every $1000 of capital at 1:50 leverage(as it was described above))
The bigger the distance is the less lot I open as I stick with the $12,5 to be risked
I set the Stop Loss at -10% so the Risked pip will be 20%
B) If it all goes wrong and and the market goes against me once the set S/L is reached I close 100% of the trade
C) If 20% will be reached I close half of the trade and set S/L to Break Even.
if it all goes down Ill make 45% of the risked money.
D) If 50% will be reached I close the half of the remaining trade so only one quarter will be left open and set S/L to 20%
if all goes wrong at this point Ill make 123,75% of the risked money
E) If 90% will be reached I close the last quarter making 202,5% of the risked money.
If I had 100 trades and every one of the outcomes would happen as often as hard it is to achieve meaning winning 202,5 is twice as hard than losing 100 and winning 45 is bit more than twice as easy than losing a 100 it will come at the total of every trade has a 44,2% portential
IMPORTANT: THE 0->100 DISTANCE HAS TO BE AT LEAST 50 PIP SO THE INITIAL RISKED PIP WILL BE 10PIP AT LEAST!!!
Also i am thinking on starting the trade only once 0 has been touched and went back to 10% again.
If the price passes the support line and goes a bit further my scale will stretch with the the candle (?? as long as if it is a bullish trend the price doesnt go under the previous important low??)
Once the trade has started all the emotions and closed off and there is nothing left to do apart from keeping and eye on what is going on and follow the rules meaning closing parts of the trade and resetting the S/L line.
Here is an example of how this strategy works.
(Please ignore the red dotted lines as not all the trades have been actually traded for certain reason such as I cant watch the market at all times because I have a full time work (12 hours a day) and some lines are not correct because I use mobile app as well and this particular week I closed my 2 running trade in a wrong order from my phone. (meaning 2 trade runs and pending order to close a part of the trade closed the part of the other trade not the one I originally wanted but the result was all the same)
Attached Image (click to enlarge)
As you can see it works quite fine
What I am asking from all of you who is reading this post is try to tell me:
- How could my entry points be more reliable
- What indicators would you use
- What rules would you add or modify
- Any other idea is welcomed!!
Thank you for reading, I am looking forward to read your comments!
[highlight=rgba(17, 17, 17, 0.901961)]en → hu
azonos
melléknév: azonos, ugyanaz, ugyanilyen
névmás: ugyanaz[/highlight]