Hi Guys, I recently started looking at divergence as an additional confirmation tool for my trades. So i'm kind of relatively new. While I know about the standard bull/bear divergence and 'trying' to understand hidden/reverse divergence, I often came across this pattern.
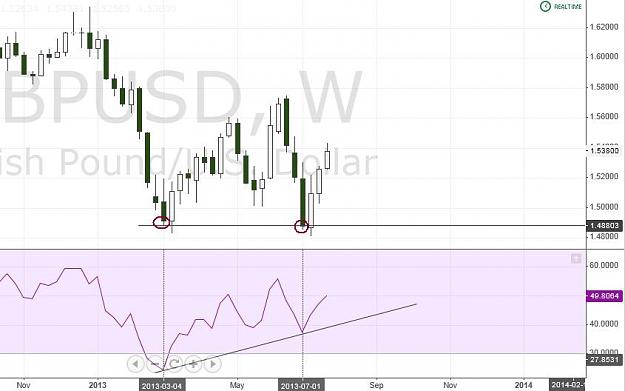
GBPUSD/Weekly with RSI 14
GBPUSD/Weekly with RSI 14
Attached Image (click to enlarge)
- RSI makes higher lows
- Price Action doesn't make any higher lows. In fact it pretty much reaches the previous price level.
What's confusing is that this would ideally look as a double bottom? So a bullish PA, so to speak?
How do you trade such formations..
Are they valid? Or do we just ignore these formations?
...and can someone refer me to the right resource to read about these formations?
Thanks.