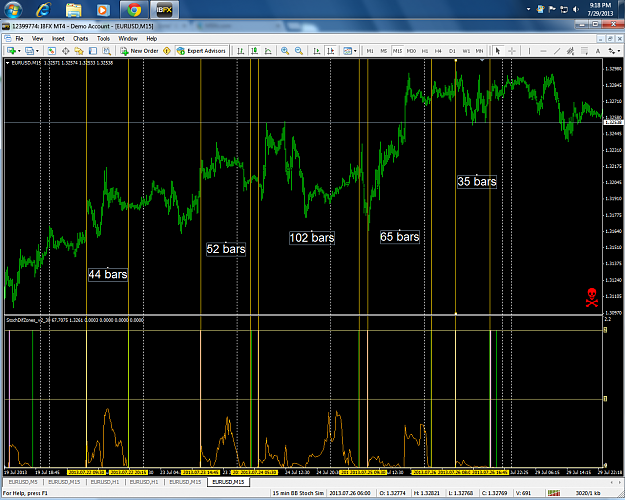
DislikedSorry, this chart does not have much to do with similarity, but I still find it interesting because I think its important to know where we have support and resistance when trading Stoch/BB/ZZ or sim/dis-sim or whatever we trade. Price is currently "stuck" between EMA89 and EMA365 on the M15. If it breaks EMA89 I think we could get at nice move up and close the zone. Se also how price respected the EMA365 after that fall it did. Anyway, whats your view of this? {image}Ignored
If you are good at something, never do it for free--Joker