• Home
  • Forums
  • Trades
  • News
  • Calendar
  • Market
  • Brokers
  • Login
  • Join
  • User/Email: Password:
  • 7:01am
Menu
  • Forums
  • Trades
  • News
  • Calendar
  • Market
  • Brokers
  • Login
  • Join
  • 7:01am
Sister Sites
  • Metals Mine
  • Energy EXCH
  • Crypto Craft

Options

Bookmark Thread

First Page First Unread Last Page Last Post

Print Thread

Similar Threads

Supply and Demand Zones 46 replies

Price movement as a function of Supply and Demand 43 replies

Supply and demand zones and EW principles 1 reply

How Markets Work, in a Nutshell! 32 replies

Demand and Supply 1 reply

  • Commercial Content
  • /
  • Reply to Thread
  • Subscribe
  • 5,251
Attachments: Supply and demand in a nutshell by Alfonso Moreno
Exit Attachments
Tags: Supply and demand in a nutshell by Alfonso Moreno
Cancel

Supply and demand in a nutshell by Alfonso Moreno

  • Last Post
  •  
  • 1 286287Page 288289290 486
  • 1 Page 288 486
  •  
  • Post #5,741
  • Quote
  • Jun 23, 2015 11:55pm Jun 23, 2015 11:55pm
  •  yyc196
  • | Joined Oct 2006 | Status: PIP Sheker | 459 Posts
Quoting Chawl
Disliked
{quote} I've found this last webinar enlightening like no other as it has cleaned many bits and bobs which usually confuse intermediates like me, it indeed was a direct hit. Thank you very much!
Ignored
HiWould you mind post the link for the video please ? Many thankd.
 
 
  • Post #5,742
  • Quote
  • Jun 23, 2015 11:56pm Jun 23, 2015 11:56pm
  •  yyc196
  • | Joined Oct 2006 | Status: PIP Sheker | 459 Posts
Quoting yyc196
Disliked
{quote} HiWould you mind post the link for the video please ? Many thankd.
Ignored
I think i manage to find it thks.
 
 
  • Post #5,743
  • Quote
  • Jun 24, 2015 4:18am Jun 24, 2015 4:18am
  •  digitalko
  • | Joined Oct 2014 | Status: Member | 34 Posts
Hello traders,
I have another interesting example for you.
I am attaching 4H chart of GU

M is in consolidation
W is up
D is up high in the curve
4H is up based on ascending TL which was not broken yet, but there is latest descending TL which is connecting last two peaks

I had the long trade setup on the drawn 4H demand zone which is as seen on the chart working for now
I canceled this market order as I spotted the descending TL, another thing that invalidated the trade was that the price is too high in HT Daily curve

Does anybody disagree per the rules with this rational?
Lately I have seen situations when on particular timeframe the trendline was not broken yet but opposing TL was created. This happens when the price is trending by shallow swings and then moves creating one or 2 CPs, then hits opposing zone (mostly CP which is low probability against the current trend) and starts to create shallow swings in opposing trend direction. This creates the flag pattern and for me all the CPs inside this triangle are invalid even no zone was broken. In terms of Zone I mean supply or demand level which should be valid to trade from, but is negated by this not steep newly created opposing TL. Am I correct?
Attached Image (click to enlarge)
Click to Enlarge

Name: GBPUSD 4H.jpg
Size: 477 KB
 
 
  • Post #5,744
  • Quote
  • Jun 24, 2015 6:38am Jun 24, 2015 6:38am
  •  Chawl
  • | Joined Feb 2012 | Status: Member | 241 Posts
Quoting digitalko
Disliked
Hello traders, I have another interesting example for you. I am attaching 4H chart of GU M is in consolidation W is up D is up high in the curve 4H is up based on ascending TL which was not broken yet, but there is latest descending TL which is connecting last two peaks I had the long trade setup on the drawn 4H demand zone which is as seen on the chart working for now I canceled this market order as I spotted the descending TL, another thing that invalidated the trade was that the price is too high in HT Daily curve Does anybody disagree per the...
Ignored
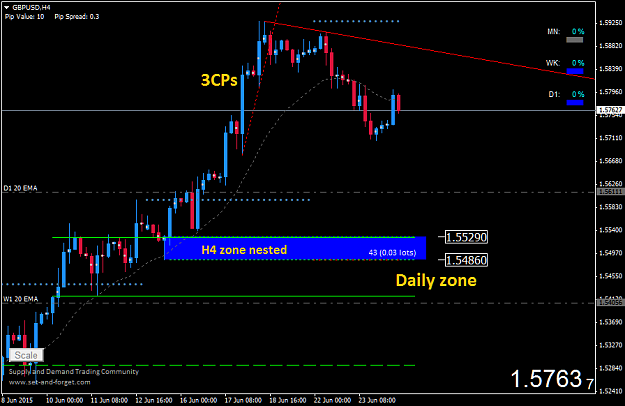
My H4 view is somewhat different than yours. I'd prefer to wait the daily demand and would see what happens.
Attached Image (click to enlarge)
Click to Enlarge

Name: GBPUSDH4.png
Size: 32 KB
Trade what you see..
 
 
  • Post #5,745
  • Quote
  • Jun 24, 2015 7:09am Jun 24, 2015 7:09am
  •  digitalko
  • | Joined Oct 2014 | Status: Member | 34 Posts
Quoting Chawl
Disliked
{quote} My H4 view is somewhat different than yours. I'd prefer to wait the daily demand and would see what happens. {image}
Ignored
Hi,
You are right I overlooked 3CPs
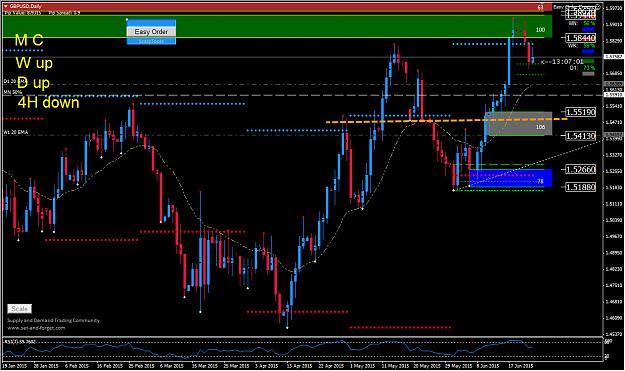
The daily demand zone is in between of D and W EMA what adds confluence, and it is right at the flipzone as well.
As you can see on my chart the D zone is not very clear, created by hammer.
I would wait for 4H confirmation to the upside.

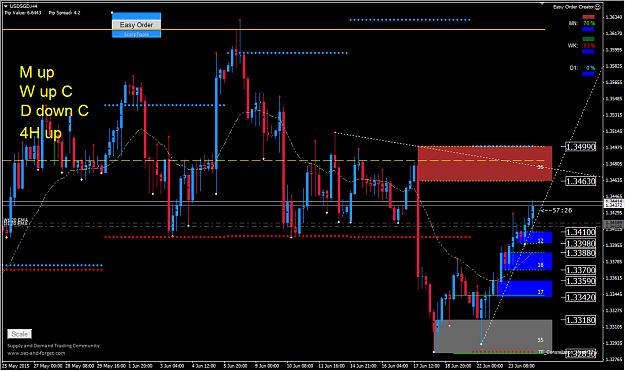
Next chart is USDSGD 4H
This one is the case when two opposing TLs can be drawn
descending TL was not broken yet and in my opinion is valid, unless it is negated by ascending TL which occurred later in time and is connecting 3 drawn CPs
Is the trend UP or DOWN?

In my opinion it is UP as I consider the latest valid TL
Attached Image(s) (click to enlarge)
Click to Enlarge

Name: GBPUSD D.jpg
Size: 281 KB
Click to Enlarge

Name: USDSGD 4H.jpg
Size: 263 KB
 
 
  • Post #5,746
  • Quote
  • Edited 9:23am Jun 24, 2015 9:01am | Edited 9:23am
  •  Chawl
  • | Joined Feb 2012 | Status: Member | 241 Posts
Quoting digitalko
Disliked
{quote} Hi, You are right I overlooked 3CPs The daily demand zone is in between of D and W EMA what adds confluence, and it is right at the flipzone as well. As you can see on my chart the D zone is not very clear, created by hammer. I would wait for 4H confirmation to the upside. Next chart is USDSGD 4H This one is the case when two opposing TLs can be drawn descending TL was not broken yet and in my opinion is valid, unless it is negated by ascending TL which occurred later in time and is connecting 3 drawn CPs Is the trend UP or DOWN? In my opinion...
Ignored
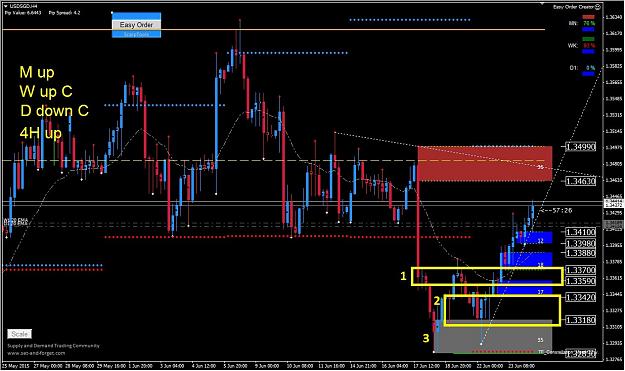
If I'm not wrong, we can not say that we are in an up trend only by looking only to the latest trend line but a supply zone had to be be eliminated also. I don't have this pair on my broker so I can't check myself, BUT if "1" is really a valid supply zone, then "2" and "3" are valid demand zones also, thus we can say that there is an up trend on H4, if otherwise, then we have only consolidation but I still don't know if "3:1 move away of price makes a zone valid" rule could be applied to "3" anyway, so Alfonso might kindly clear this
Attached Image (click to enlarge)
Click to Enlarge

Name: USDSGD 4H.jpg
Size: 222 KB
Trade what you see..
 
 
  • Post #5,747
  • Quote
  • Jun 24, 2015 9:08am Jun 24, 2015 9:08am
  •  digitalko
  • | Joined Oct 2014 | Status: Member | 34 Posts
Quoting Chawl
Disliked
{quote} If I'm not wrong, we can not say that we are in an up trend only by looking only to the latest trend line but a supply zone had to be be eliminated also. I don't have this pair on my broker so I can't check myself, BUT if "1" is really a valid supply zone, then "2" and "3" are valid demand zones also, thus we can say that there is an up trend on H4, if otherwise, then we have only consolidation. {image}
Ignored
Exactly as you explained. We are in 4H up trend even the previous descending TL is not broken.Do we invalidate the previous TL as new trend occurs as in this scenario or not?Alfonso please make it clear for us.Thank you in advance.
 
 
  • Post #5,748
  • Quote
  • Jun 24, 2015 9:31am Jun 24, 2015 9:31am
  •  Chawl
  • | Joined Feb 2012 | Status: Member | 241 Posts
Quoting digitalko
Disliked
{quote} Exactly as you explained. We are in 4H up trend even the previous descending TL is not broken.Do we invalidate the previous TL as new trend occurs as in this scenario or not?Alfonso please make it clear for us.Thank you in advance.
Ignored
If I'm confused, I generally take trend lines into account secondarily but primarily focus on which types zones are created and eliminated lately. Alfonso might kindly judge my trend assessment strategy also
Trade what you see..
 
 
  • Post #5,749
  • Quote
  • Jun 24, 2015 11:47am Jun 24, 2015 11:47am
  •  yyc196
  • | Joined Oct 2006 | Status: PIP Sheker | 459 Posts
Hi All,

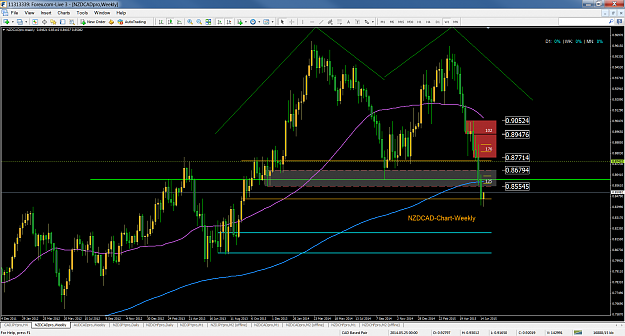
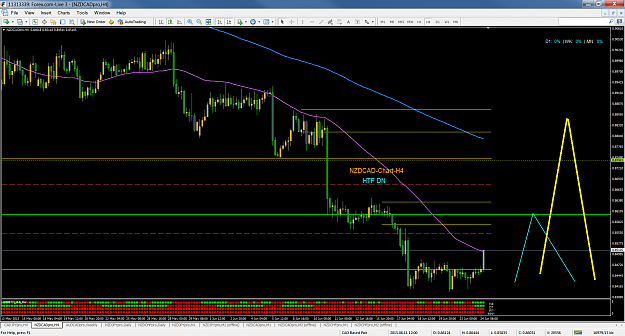
Saw this setup and felt that it is quite nice, the weekly removed Dz and now daily mkt is returning back to test the zones as shown by the blue and yellow lines. Yellow line should be higher odds, i guess.
Attached Image(s) (click to enlarge)
Click to Enlarge

Name: Image1.png
Size: 105 KB
Click to Enlarge

Name: Image2.png
Size: 96 KB
 
 
  • Post #5,750
  • Quote
  • Jun 24, 2015 1:50pm Jun 24, 2015 1:50pm
  •  Bigotibor
  • | Joined Aug 2014 | Status: Member | 3 Posts
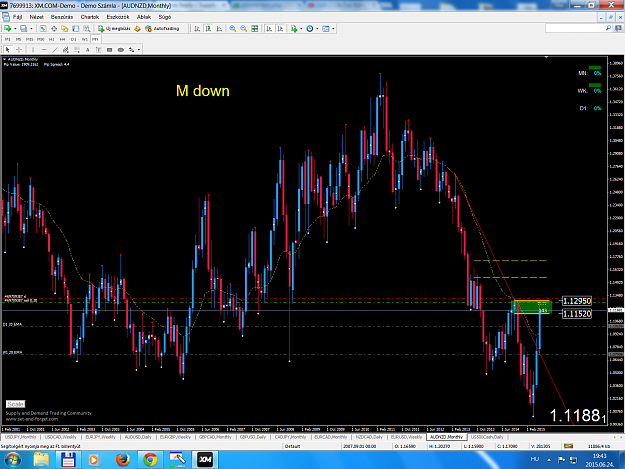
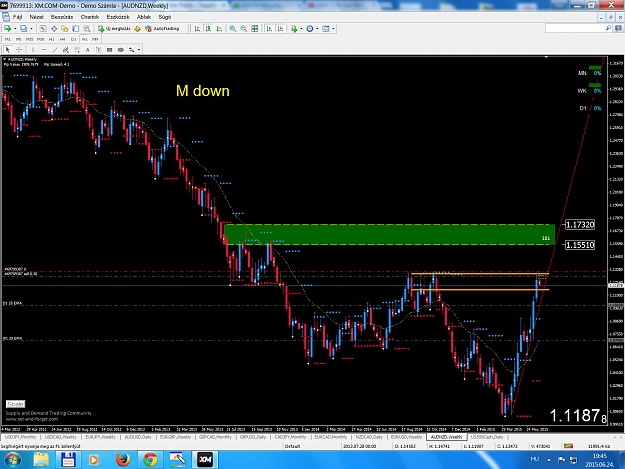
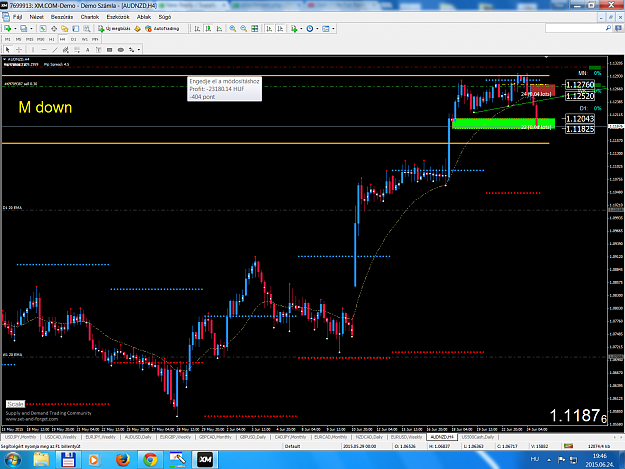
HI traders!
M down barely has broken SZ.
W up
4h Didn't brake D but if. We have a sell at S. This supply broke the TL.
Attached Image(s) (click to enlarge)
Click to Enlarge

Name: Screenshot7.png
Size: 250 KB
Click to Enlarge

Name: Screenshot8.png
Size: 256 KB
Click to Enlarge

Name: Screenshot9.png
Size: 256 KB
 
 
  • Post #5,751
  • Quote
  • Jun 24, 2015 6:40pm Jun 24, 2015 6:40pm
  •  Chawl
  • | Joined Feb 2012 | Status: Member | 241 Posts
Quoting Bigotibor
Disliked
HI traders! M down barely has broken SZ. W up 4h Didn't brake D but if. We have a sell at S. This supply broke the TL. {image} {image} {image}
Ignored
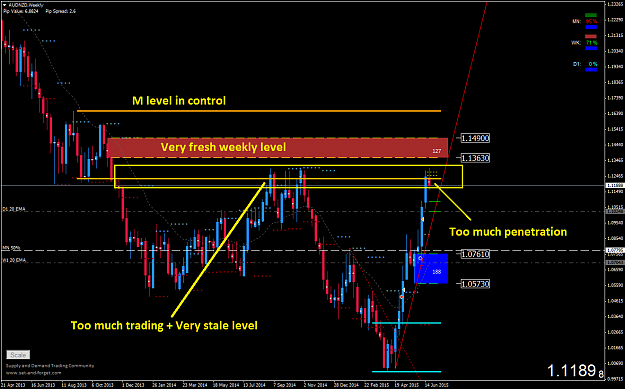
I want to play the devil's advocate and shake your AUDNZD analysis a bit
Attached Image (click to enlarge)
Click to Enlarge

Name: AUDNZDWeekly.png
Size: 56 KB
Trade what you see..
 
 
  • Post #5,752
  • Quote
  • Edited 9:36pm Jun 24, 2015 8:54pm | Edited 9:36pm
  •  Chawl
  • | Joined Feb 2012 | Status: Member | 241 Posts
Quoting yyc196
Disliked
Hi All, Saw this setup and felt that it is quite nice, the weekly removed Dz and now daily mkt is returning back to test the zones as shown by the blue and yellow lines. Yellow line should be higher odds, i guess. {image} {image}
Ignored
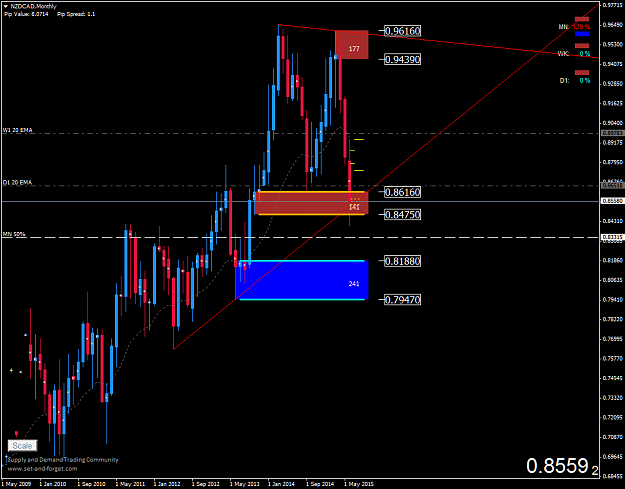
As daily descending TL was broken, I think blue trade will be very risky though it sports an original and fresh daily SZ, so I'm with you that yellow will be a higher probability/lower risk trade as it is nested in a weekly supply BUT if price climbs quick enough without breaking the weekly descending TL, otherwise we should rely on a monthly SZ.

I want to make another point here. Although monthly has an illusion of downtrend as we can connect two peaks with a descending TL and an opposing demand was eliminated, price still didn't close under breached DZ and didn't consolidate away the monthly ascending TL but just sits on it, so I think monthly is still up, at best in a consolidation, so shorts might be CT now, I hope Alfonso might clear this. What's more, 'fat fingers' who will be acting upon monthly bar close 5 days later may very well shake the lower time frames, especially during the times when price is dancing on the edges like now.

And a note to community, I hope I haven't annoyed you people by commenting too much in the absence of Alfonso but I think community discussions are also quite beneficial for learning and arouse new questions for Alfonso to clear, so I take the risk
Attached Image (click to enlarge)
Click to Enlarge

Name: NZDCADMonthly.png
Size: 54 KB
Trade what you see..
 
 
  • Post #5,753
  • Quote
  • Jun 25, 2015 2:04am Jun 25, 2015 2:04am
  •  yyc196
  • | Joined Oct 2006 | Status: PIP Sheker | 459 Posts
Quoting Chawl
Disliked
{quote} As daily descending TL was broken, I think blue trade will be very risky though it sports an original and fresh daily SZ, so I'm with you that yellow will be a higher probability/lower risk trade as it is nested in a weekly supply BUT if price climbs quick enough without breaking the weekly descending TL, otherwise we should rely on a monthly SZ. I want to make another point here. Although monthly has an illusion of downtrend as we can connect two peaks with a descending TL and an opposing demand was eliminated, price still didn't close...
Ignored
Hi Chawl,

Thank you so much for the deep analysis, love to see this kind of comments. Alfonso and some of you have make the discussion here so interactive and interesting. As market is dynamic it is good to see different people with different angle of perspective
 
 
  • Post #5,754
  • Quote
  • Jun 25, 2015 10:41am Jun 25, 2015 10:41am
  •  Chawl
  • | Joined Feb 2012 | Status: Member | 241 Posts
Quoting yyc196
Disliked
{quote} Hi Chawl, Thank you so much for the deep analysis, love to see this kind of comments. Alfonso and some of you have make the discussion here so interactive and interesting. As market is dynamic it is good to see different people with different angle of perspective
Ignored
U r welcome I wish Alfonso could comment here soon too.
Trade what you see..
 
 
  • Post #5,755
  • Quote
  • Jun 26, 2015 2:54am Jun 26, 2015 2:54am
  •  sonigl
  • | Joined Jan 2014 | Status: be survive | 84 Posts
hello guys...

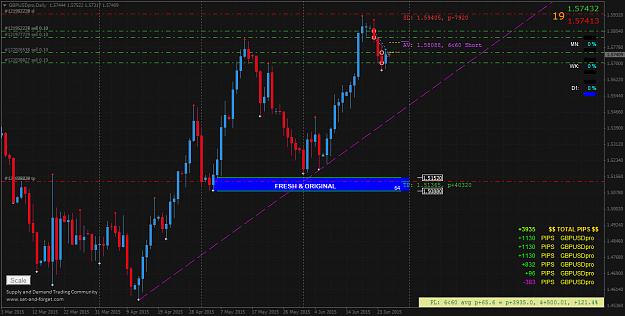
i'd like to share my cable analysis, here the chart....
Attached Image (click to enlarge)
Click to Enlarge

Name: GBPUSDproDaily_260615.png
Size: 79 KB

My plan is make a BUY LIMIT @1.51520

i'd like to hear any comment of you guys....

regards,
sonigl
 
 
  • Post #5,756
  • Quote
  • Jun 26, 2015 4:59am Jun 26, 2015 4:59am
  •  panoramia
  • | Commercial Member | Joined Aug 2011 | 3,539 Posts
Quoting Chawl
Disliked
{quote} I've found this last webinar enlightening like no other as it has cleaned many bits and bobs which usually confuse intermediates like me, it indeed was a direct hit. Thank you very much!
Ignored
Glad you found the webinar useful and enlightening my friend, glad to help! You are welcome!
Have a great weekend

Alfonso
Set and Forget supply and demand trading community
 
 
  • Post #5,757
  • Quote
  • Jun 26, 2015 5:00am Jun 26, 2015 5:00am
  •  panoramia
  • | Commercial Member | Joined Aug 2011 | 3,539 Posts
Quoting digitalko
Disliked
Hello fellow traders, I have an interesting example here on AUDUSD M is down at 50% holding for coupple of months W is down but very low, descending TL broken, price retraced back into area of old demand and nested newly created W demand area (which caused break of the TL) price is starting to raley D is up 4H was up see TL1, untill TL2 was created, circled 4H demand CP zone broke higher with 2 nice ERC candles. My question is: what do we do in this kind of scenarious? TL2 is valid even TL1 was not broken yet. Was the trade in circled demand valid?...
Ignored
AUD/USD is in a bigger picture downtrend, when that happens, short is the way to go on strong supply zones and brand new zones created at HTF zones. Longs can and will work many times, you just have to decide which TF and direction you want to take.

Cheers,
Alfonso
Set and Forget supply and demand trading community
 
 
  • Post #5,758
  • Quote
  • Jun 26, 2015 5:01am Jun 26, 2015 5:01am
  •  panoramia
  • | Commercial Member | Joined Aug 2011 | 3,539 Posts
Quoting Bigotibor
Disliked
HI traders! M down barely has broken SZ. W up 4h Didn't brake D but if. We have a sell at S. This supply broke the TL. {image} {image} {image}
Ignored
Bigger picture is down on AUD/NZD, monthly supply zone in control. Short is the way to go.

Cheers,
Alfonso
Set and Forget supply and demand trading community
 
 
  • Post #5,759
  • Quote
  • Edited 12:18pm Jun 26, 2015 11:36am | Edited 12:18pm
  •  Chawl
  • | Joined Feb 2012 | Status: Member | 241 Posts
Quoting sonigl
Disliked
hello guys... i'd like to share my cable analysis, here the chart.... {image} My plan is make a BUY LIMIT @1.51520 i'd like to hear any comment of you guys.... regards, sonigl
Ignored
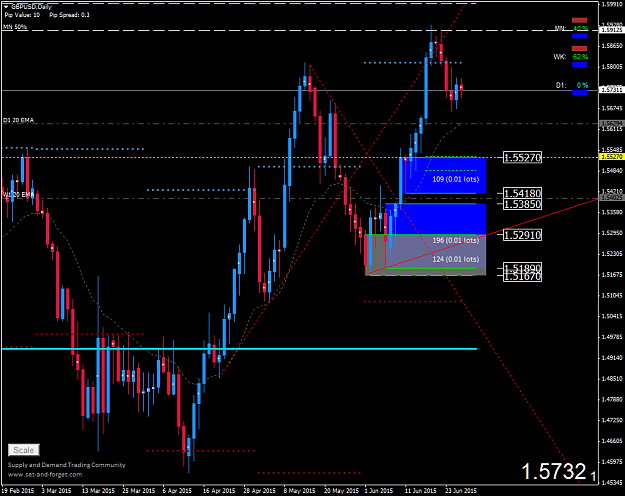
I'll probably take the risk to go long around 1.55270. Here's my daily view of GBPUSD:
Attached Image (click to enlarge)
Click to Enlarge

Name: GBPUSDDaily.png
Size: 57 KB
Trade what you see..
 
 
  • Post #5,760
  • Quote
  • Jun 26, 2015 5:13pm Jun 26, 2015 5:13pm
  •  sonigl
  • | Joined Jan 2014 | Status: be survive | 84 Posts
Quoting Chawl
Disliked
{quote} I'll probably take the risk to go long around 1.55270. Here's my daily view of GBPUSD: {image}
Ignored
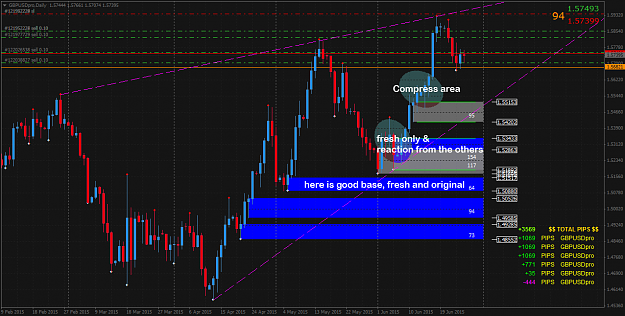
here is my explanation on chart...
Attached Image (click to enlarge)
Click to Enlarge

Name: GBPUSDproDaily_260615_3.png
Size: 49 KB


thx & regards,
sonigl
 
 
  • Commercial Content
  • /
  • Supply and demand in a nutshell by Alfonso Moreno
  • Reply to Thread
    • 1 286287Page 288289290 486
    • 1 Page 288 486
1 trader viewing now
  • More
Top of Page
  • Facebook
  • Twitter
About FF
  • Mission
  • Products
  • User Guide
  • Media Kit
  • Blog
  • Contact
FF Products
  • Forums
  • Trades
  • Calendar
  • News
  • Market
  • Brokers
  • Trade Explorer
FF Website
  • Homepage
  • Search
  • Members
  • Report a Bug
Follow FF
  • Facebook
  • Twitter

FF Sister Sites:

  • Metals Mine
  • Energy EXCH
  • Crypto Craft

Forex Factory® is a brand of Fair Economy, Inc.

Terms of Service / ©2023