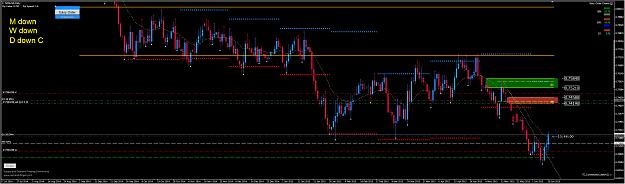
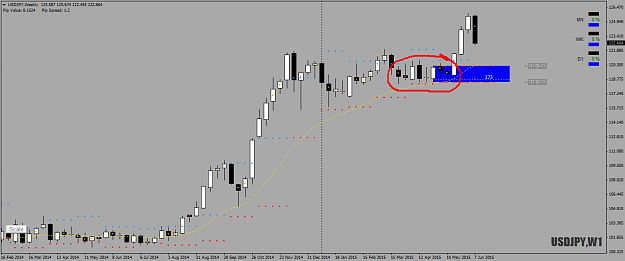
DislikedThis is an exoctic pair, Dollar versus Turkish Lira, I've taken quite a few longs on this currency pairs while bouncing off Monthly and Weekly demand. Now USD/TRY broke high above all time highs with a gap up and strong potential Daily demand zone, consolidation away is needed Long bias at valid Daily demand zones or lower at Weekly demand zones Cheers, Alfonso {image}Ignored
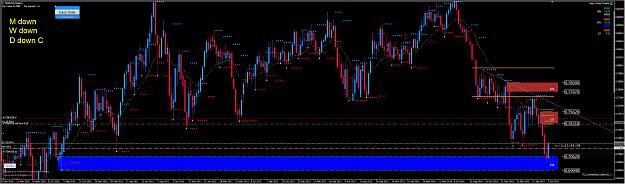
2. When price break higher above all time highs should we wait for close above previous high before go long? What timeframe is recommended to be closed above? Weekly or daily? How do you personally do?