Quoting JureDislikedHi all!
The VWB2 document inspired me to play a bit with statistics ...
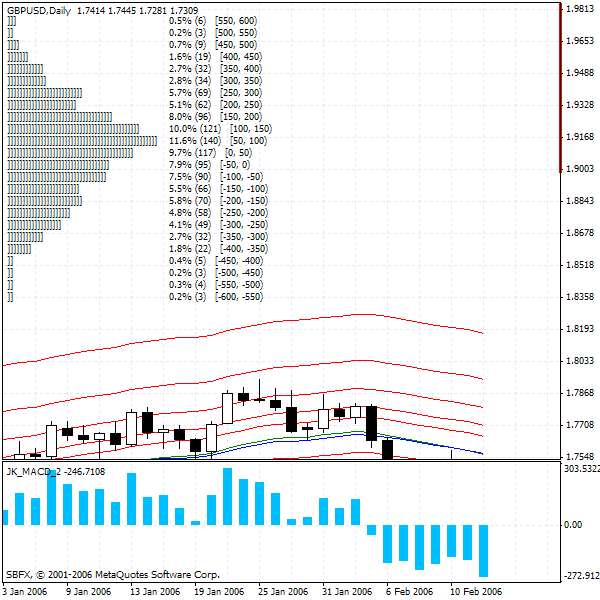
So, for starters, I made an indicator showing price distribution around the daily EMA. The picture shows a closing price distribution around EMA-24 on the daily chart.
Well, it's interesting, and I'm not really sure how to interpret it, other than: price tends to stay away from the EMA (?). Also, the distribution pattern is very much the same across different pairs. The dip in the pattern is probably caused by the subtraction of moving average from the price. Any ideas/comments?
p.s.: I hope this isn't too off-topic ...Ignored
Hello Jure: Great Indicator you have created, is this indicador for M4? do you mind sharing it with the group? Thanls a lot.
GS