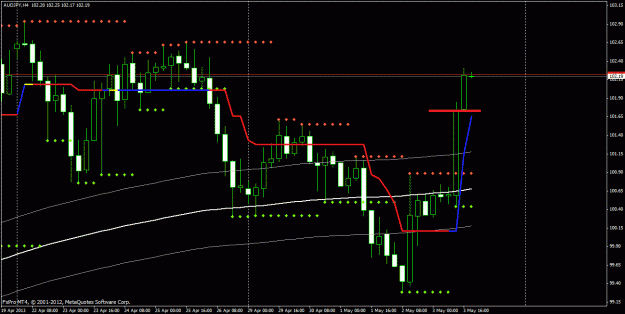
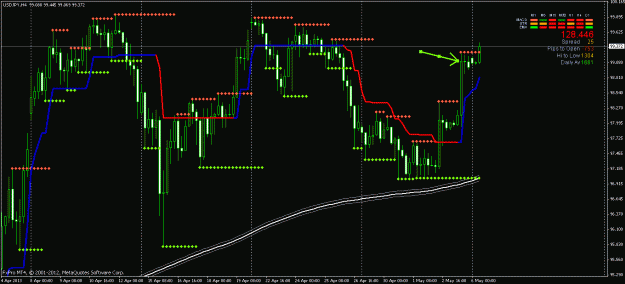
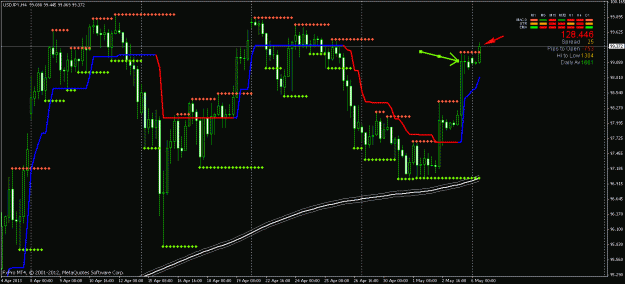
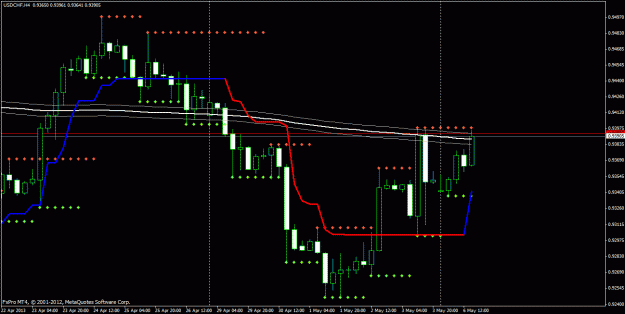
DislikedHi Ilzalama, Thanks for the reply. Seeing your trades I feel that besides your all regular conditions, you also considering 200 MA curve, distance between R & S lines and colour of MACD,STR & EMA. Am I right? BomiIgnored
I do not really consider the curve or angle of the 200 SMA. Of course it helps if it is pointing in the direction I am trading in, but as I stated in Post 1 " The 200 SMA is the most widely used and accepted Moving Average across all markets. It is especially useful in long term trading. In this method I use the 200 SMA to show the over all trend in the current TF. When price is below the line, I look for only shorts. It helps if the line is also trending down but it is not necessary. If you take a short trade because price closes under, I mean the price, not just if it spikes through, and the 200 SMA is either long or flat, the risk of the trade is higher that it will fail. That does not mean do not trade, it just means the likely hood of failure is high"
The distance between S&R does come into play. As I stated in post 45, " Now what if there is an established S&R. For me, there must be at least a 30 pip space between the HIGH/LOW of the candle that closes above/below supertrend & the established S&R. Why? 30 PIPS is MY magic number. That is when I can secure +3 and now have 0 risk on trade."
As for MACD,STR & EMA, if you are referring to the Signals Daily Indi, I do not consider the information on that indi for trade execution. I use it for a visual guide for current price and spread. No other reason.
-ILZ
“Control, control, you must learn control!” - Yoda


