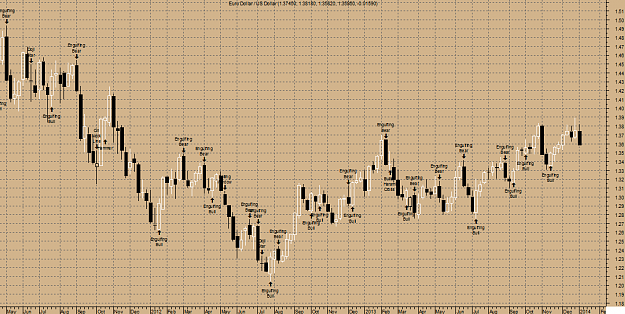
EUR/USD WEEKLY as of Monday, 23 December, 2013
A white body has formed as prices closed higher than open.
The previous 10 candlestick bars, there are 7 white candles versus 3 black candles with a net of 4 white candles.
The previous 50 candlestick bars, there are 27 white candles versus 22 black candles with a net of 5 white candles.
A long lower shadow has formed. This is typically a bullish signal (particularly when it occurs near a low price level, at a support level, or when the security is oversold).MACD is BULLISH as the MACD is above the signal line.
The MACD crossedabove the signal line 22 period(s) ago. Since the MACD crossed the MACD moving average, Euro Dollar / US Dollar's price has increased 3.00%, and has been fluctuating from a high of 1.383 to a low of 1.310.
The weekly ADX is currently below both Plus and Minus Directional indicators. The weekly Directional Movement Indicators (DMI) currently is not indicating a specific price direction.
SAR signal was a Buy2 period(s) Ago.
The close is currently
ABOVE its 200 weekly moving average
ABOVE its 50 weekly moving average
ABOVE its 20 weekly moving average
The current market condition for Euro Dollar / US Dollar is Very Bullish
Euro Dollar / US Dollar closed below the upper Bollinger Band by 26.4%. Bollinger Bands are 46.77% narrower than normal. The narrow width of the Bollinger Bands suggests low volatility as compared to Euro Dollar / US Dollar's normal range. Therefore, the probability of volatility increasing with a sharp price move has increased for the near-term. The Bollinger Bands have been in this narrow range for 5 period(s). The probability of a significant price move increases the longer the Bollinger Bands remain in this narrow range.
Elliott Waves High Volatility has detected a possible point 4 of a WolfWave (21%) pattern for Euro Dollar / US Dollar. This pattern is an expanding triangle and trades from the next point. When the peak or trough will form, usually after crossing or touching the extended line of points 1 and 3, the price will move in the opposite direction towards the target line formed by the extension of points 2 and 4.
An Inside Day Narrow Range was detected by your Elliott Waves High Volatility on 23/12/13. This is usually a trade set-up opportunity.
Elliott Waves High Volatility has detected an Isolated Low at 1.36 one bar ago; this is usually a bullish sign that is not to be used alone!
The present wave patterns are:
Euro Dollar / US Dollar is currently 2.8% above its 200-period moving average and is in an upwardtrend. Volatility is low as compared to the average volatility over the last 10 periods.Trend forecasting oscillators are currently bullish on EURUSD and have had this outlook for the last 21 periods.
Overall, the bias in prices is: Upwards.
Short term: Prices are stalling.
Intermediate term: Prices are trending.
A white body has formed as prices closed higher than open.
The previous 10 candlestick bars, there are 7 white candles versus 3 black candles with a net of 4 white candles.
The previous 50 candlestick bars, there are 27 white candles versus 22 black candles with a net of 5 white candles.
A long lower shadow has formed. This is typically a bullish signal (particularly when it occurs near a low price level, at a support level, or when the security is oversold).MACD is BULLISH as the MACD is above the signal line.
The MACD crossedabove the signal line 22 period(s) ago. Since the MACD crossed the MACD moving average, Euro Dollar / US Dollar's price has increased 3.00%, and has been fluctuating from a high of 1.383 to a low of 1.310.
The weekly ADX is currently below both Plus and Minus Directional indicators. The weekly Directional Movement Indicators (DMI) currently is not indicating a specific price direction.
SAR signal was a Buy2 period(s) Ago.
The close is currently
ABOVE its 200 weekly moving average
ABOVE its 50 weekly moving average
ABOVE its 20 weekly moving average
The current market condition for Euro Dollar / US Dollar is Very Bullish
Euro Dollar / US Dollar closed below the upper Bollinger Band by 26.4%. Bollinger Bands are 46.77% narrower than normal. The narrow width of the Bollinger Bands suggests low volatility as compared to Euro Dollar / US Dollar's normal range. Therefore, the probability of volatility increasing with a sharp price move has increased for the near-term. The Bollinger Bands have been in this narrow range for 5 period(s). The probability of a significant price move increases the longer the Bollinger Bands remain in this narrow range.
Elliott Waves High Volatility has detected a possible point 4 of a WolfWave (21%) pattern for Euro Dollar / US Dollar. This pattern is an expanding triangle and trades from the next point. When the peak or trough will form, usually after crossing or touching the extended line of points 1 and 3, the price will move in the opposite direction towards the target line formed by the extension of points 2 and 4.
An Inside Day Narrow Range was detected by your Elliott Waves High Volatility on 23/12/13. This is usually a trade set-up opportunity.
Elliott Waves High Volatility has detected an Isolated Low at 1.36 one bar ago; this is usually a bullish sign that is not to be used alone!
The present wave patterns are:
fast amplitude (8%): bullish wave 1
moderate amplitude (13%): bullish wave 3
Euro Dollar / US Dollar is long term Bullish as the 144 days moving average of 1.33 is increasing. The Relative Strength Index is at 58.87 in the neutral territory. The Relative Momentum Index is at 70.53 in the overbought territory. An important indicator for Elliott waves, the Elliott oscillator is at 0.03, in positive territory; this is a bullish sign. An equally important indicator, the STORSI is at 48.75. This value is in the neutral territory.Euro Dollar / US Dollar is currently 2.8% above its 200-period moving average and is in an upwardtrend. Volatility is low as compared to the average volatility over the last 10 periods.Trend forecasting oscillators are currently bullish on EURUSD and have had this outlook for the last 21 periods.
Overall, the bias in prices is: Upwards.
Short term: Prices are stalling.
Intermediate term: Prices are trending.