*** Intra-Daily Trading Strategy:SELLEuro Dollar / US Dollar
Sell Target: 1.3260
Sell Stop: 1.3289
Enter New SELL on OPEN and exit SELL positions at Target price or at Stop price.
(NOTE: Adjust Stop Loss Price according to your trading risk.)
Do not reverseafter exiting. This is a recommendation for INTRA-DAY TRADING only!!!!!
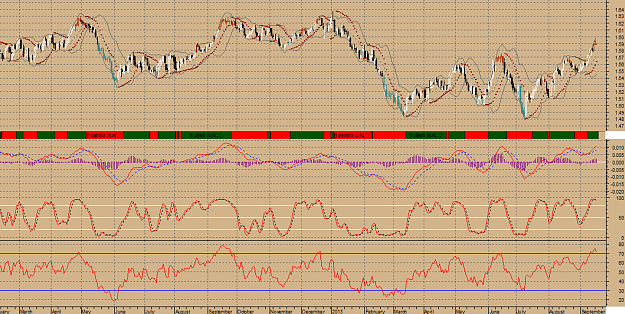
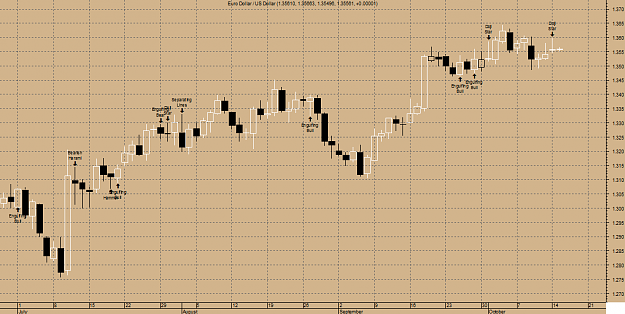
A white body has formed as prices closed higher than open.
The previous 10 candlestick bars, there are 5 white candles versus 5 black candles.
The previous 50 candlestick bars, there are 25 white candles versus 25 black candles.
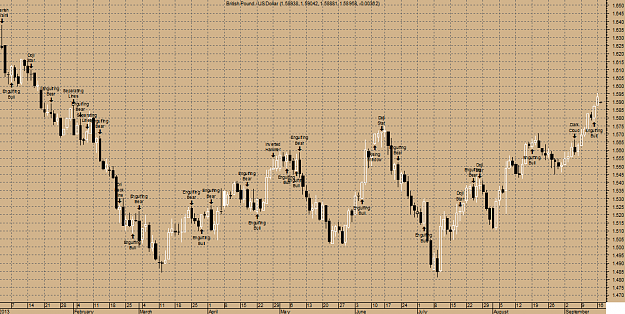
A doji star has formed where a doji gaps above or below the previous candle. This often signals a reversal with confirmation occurring on the next bar.A long upper shadow has formed. This is typically a bearish signal (particularly when it occurs near a high price level, at resistance level, or when the security is overbought).Three white candles has formed during the last three bars. Although these candles were not big enough to create three white soldiers, the steady upward pattern is bullish.
MACD is BEARISH as the MACD is below the signal line.
The MACD crossed below the signal line 14 period(s) ago. Since the MACD crossed the MACD moving average, Euro Dollar / US Dollar's price has decreased0.60%, and has been fluctuating from a high of 1.341 to a low of 1.310.
Stochastic signal was a Buy2 Period(s) Ago.
The last Directional Movement Indicators (DMI) and SAR signal was a SELL9 period(s) ago.
The close is currentlyABOVE its 200 daily moving average
ABOVE its 50 daily moving average
ABOVE its 20 daily moving average
The current market condition for Euro Dollar / US Dollar is Very Bullish. Euro Dollar / US Dollar appears to be locked in a trading range bounded by upside resistance around 1.34 and downside support around 1.28.
Euro Dollar / US Dollar closed above the lower Bollinger Band by 45.0%. Bollinger Bands are 21.00% narrower than normal. The current width of the Bollinger Bands (alone) does not suggest anything conclusive about the future volatility or movement of prices.
Technical Outlook
Short Term: Neutral
Intermediate Term: Bearish
Long Term: Bullish