[quote=hutrader;6413991]So those are my levels I watch currently with EUR/USD.
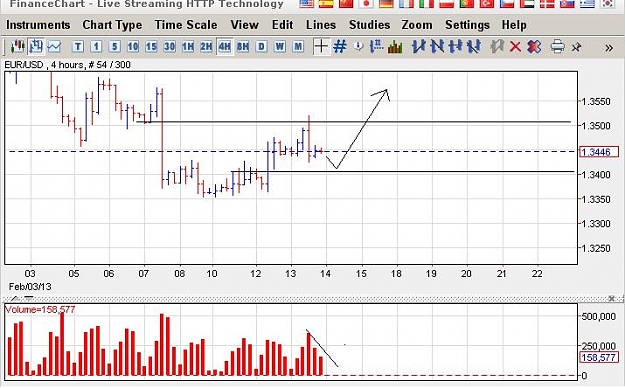
Now let's get to the important question. HOW TO DETERMIN ENTRY POINTS?
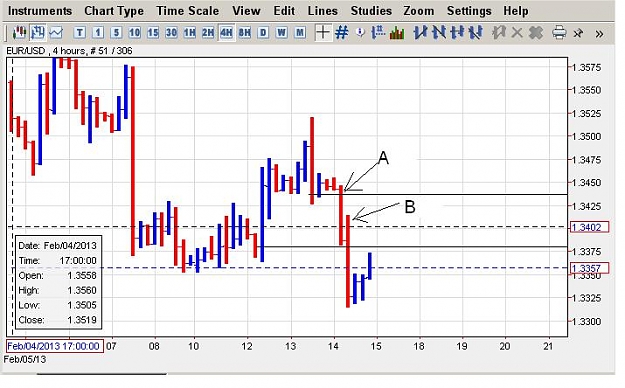
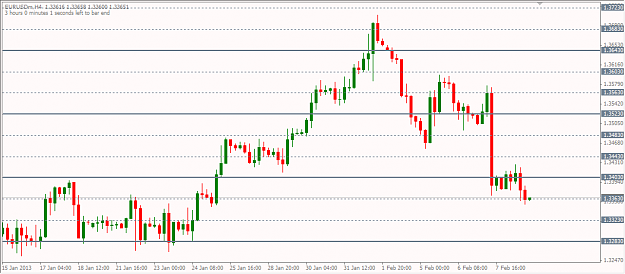
It is really just looking at the chart. If you look very good, you will see that I am setting my lines on the opens and close of the 4 hour candle. This is all you really need to know! Remember, Open and close!
hi hutrader,
i didnt understand exactly where you put your lines,at open and close of every candle or at close of bull candle and open of bear candle or at close of bull candle in an uptrend and vice versa or....
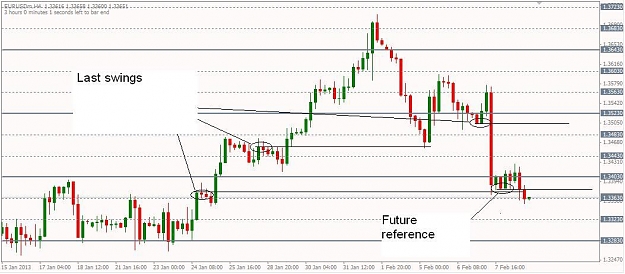
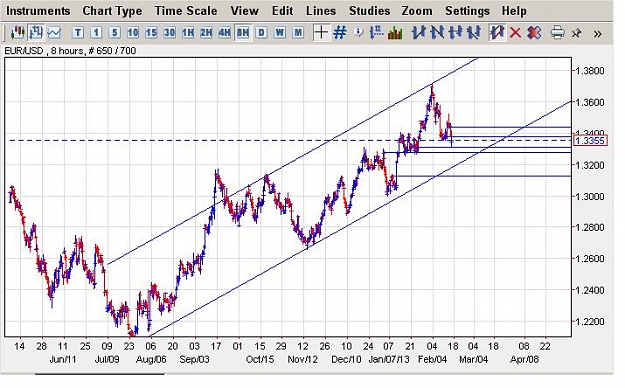
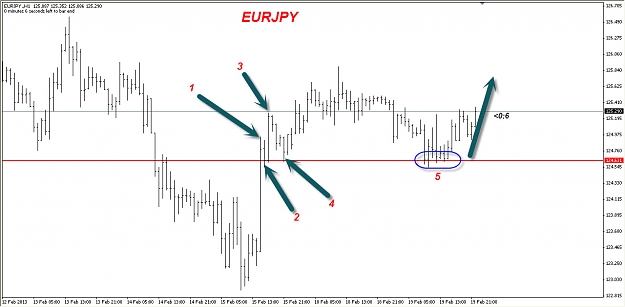
but these are my "lines"...
...last week sold at 3523 and closed at 3403...i say we will see 3283 before 3523...
so next week i would sell again at 3403/43 or even 3483 if it gets there...
Now let's get to the important question. HOW TO DETERMIN ENTRY POINTS?
It is really just looking at the chart. If you look very good, you will see that I am setting my lines on the opens and close of the 4 hour candle. This is all you really need to know! Remember, Open and close!
hi hutrader,
i didnt understand exactly where you put your lines,at open and close of every candle or at close of bull candle and open of bear candle or at close of bull candle in an uptrend and vice versa or....
but these are my "lines"...
...last week sold at 3523 and closed at 3403...i say we will see 3283 before 3523...
so next week i would sell again at 3403/43 or even 3483 if it gets there...
Attached Image (click to enlarge)
Money is made by sitting, not trading. Jesse L. Livermore