• Home
  • Forums
  • Trades
  • News
  • Calendar
  • Market
  • Brokers
  • Login
  • Join
  • User/Email: Password:
  • 9:04pm
Menu
  • Forums
  • Trades
  • News
  • Calendar
  • Market
  • Brokers
  • Login
  • Join
  • 9:04pm
Sister Sites
  • Metals Mine
  • Energy EXCH
  • Crypto Craft

Options

Bookmark Thread

First Page First Unread Last Page Last Post

Print Thread

Similar Threads

Gutenberg money printing machine.. 100 to 1.000 to 10.000 to 100.000? 15 replies

Money maker machine! 24 replies

Does More Money Mean Better Spreads? 1 reply

MEVA machine that makes money 43 replies

Journal Factory posters - how much money are you making? 17 replies

  • Trading Systems
  • /
  • Reply to Thread
  • Subscribe
  • 63
Attachments: Lean Mean Money Making Machine
Exit Attachments

Lean Mean Money Making Machine

  • Last Post
  •  
  • Page 1 23456 7
  • Page 1 234 7
  •  
  • Post #1
  • Quote
  • First Post: Edited Feb 10, 2019 1:31pm Jan 24, 2013 12:34am | Edited Feb 10, 2019 1:31pm
  •  ashur123
  • | Joined Dec 2008 | Status: Plant today. Harvest Tomorrow. | 159 Posts
Hey everyone! I'm here to show you a trading method that I have developed. This system produces incredibly accurate signals of when to buy or sell.

About me:

I have been involved with the forex markets for 9 years now. I have blown numerous accounts, but continuously kept trying. After my last big loss, I ended up putting this system together and so far it's looking very promising! I've thought about keeping this system just to my self, but now I believe I should share my idea with everyone so that we can all move forward and succeed together. I've been on this forum for quite some time now and I haven't contributed much, so here is my way of saying thank you.

Hamilton Forex System:

This system uses the Metatrader 4 hour chart and Oandas Daily chart.

Metatrader 4 hour chart
-Center of Gravity (3000,1,1.1618)
-Moving Average exponential(500)(150)(50)
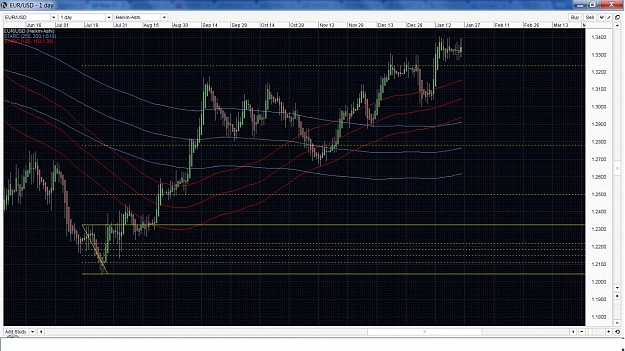
Oanda Daily Chart
-Heiken-Ashi candles
-Starc (250,300)(100,150)


BUY
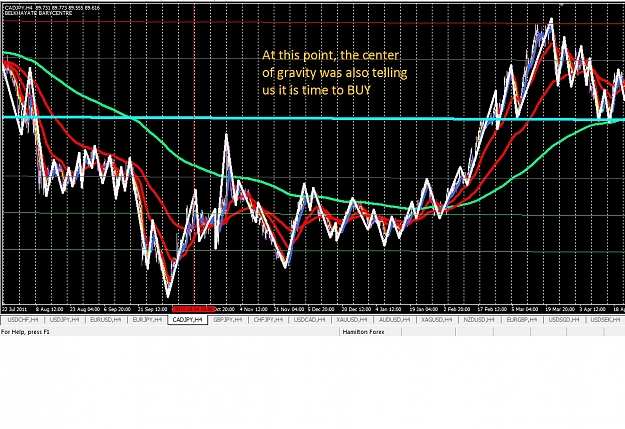
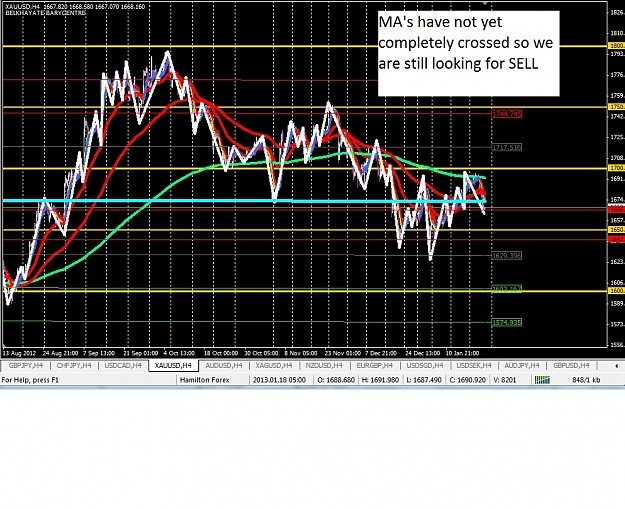
1.We look at our 4 hour metatrader chart. If moving average is all below the center of gravity, we are looking to BUY.
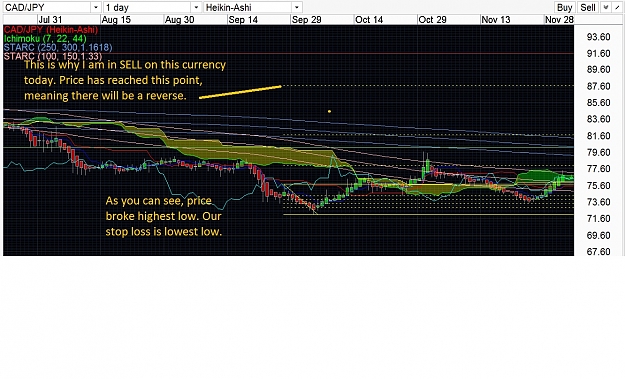
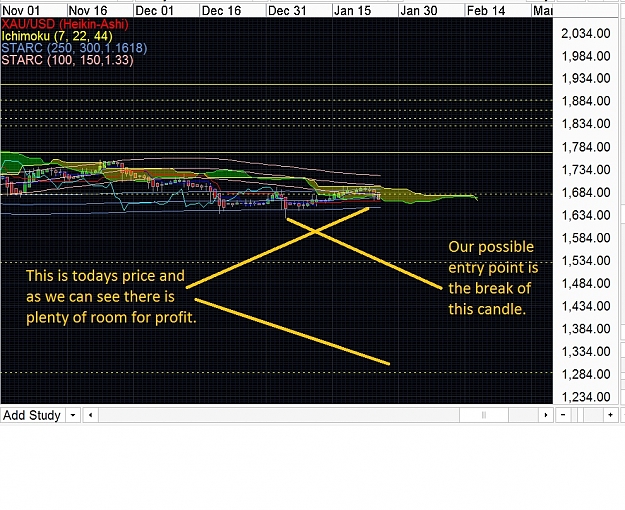
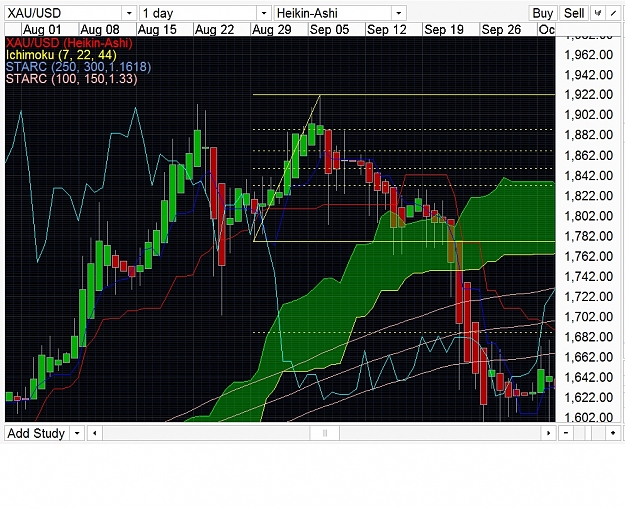
2. We then go to Oandas Daily chart, if price is below Starc bands we are good for a BUY.
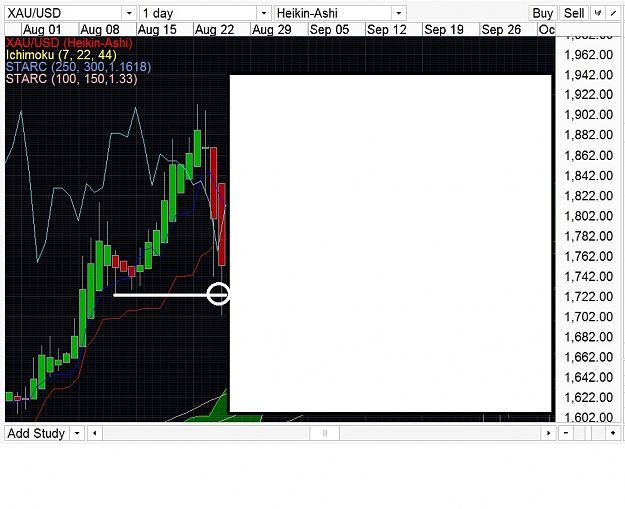
3. We wait for heiken-ashi to form new low, we put a limit order at the high of the green heiken-ashi candle that was before the train of red candles.
4. Once order is filled, we put stop loss at the low of the red candles

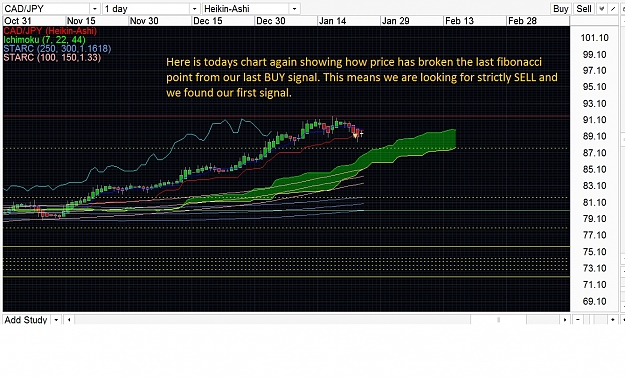
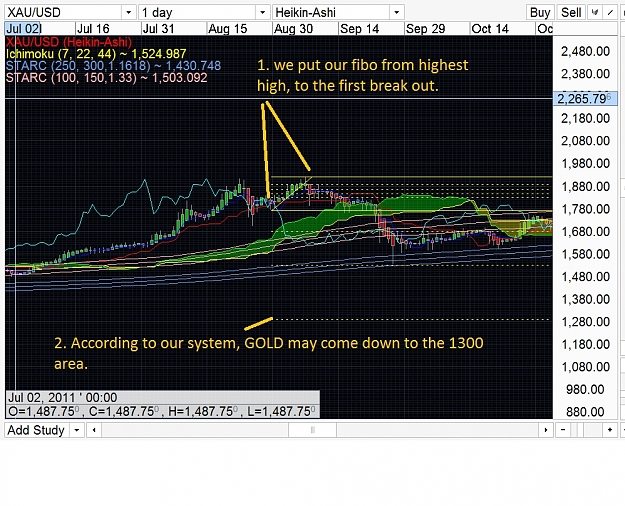
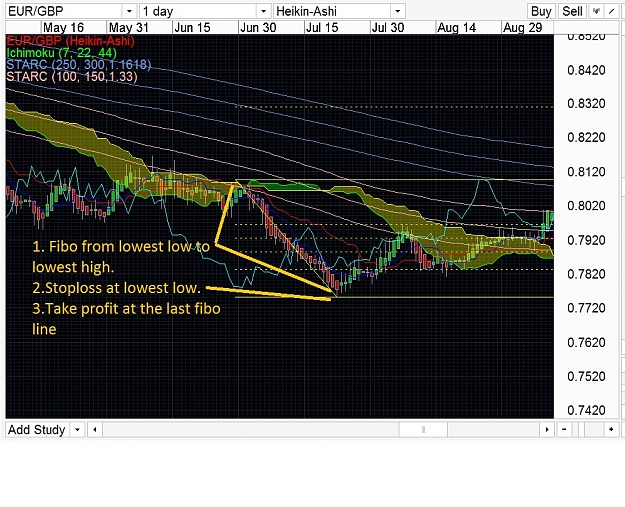
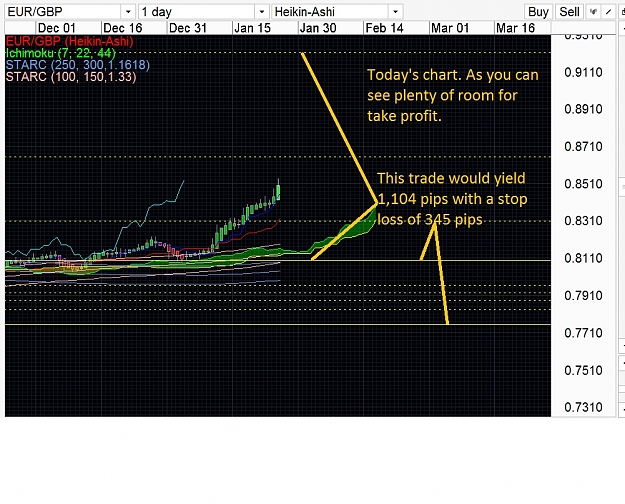
Take profit is determined by using fibonacci. You put the first point at the stoploss and the second point at the entry. Our takeprofit is the line furthest away. This is also our turning point, at this point we would begin looking for possible SELLS to form.
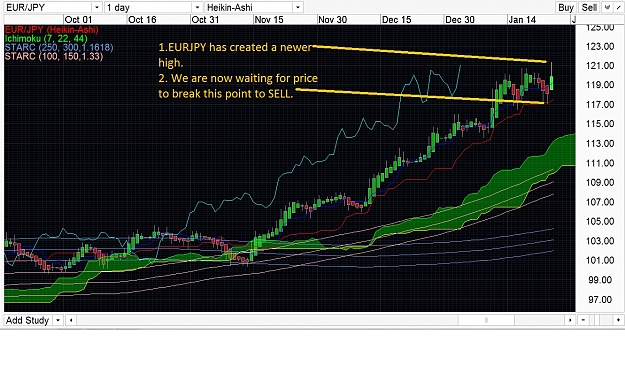
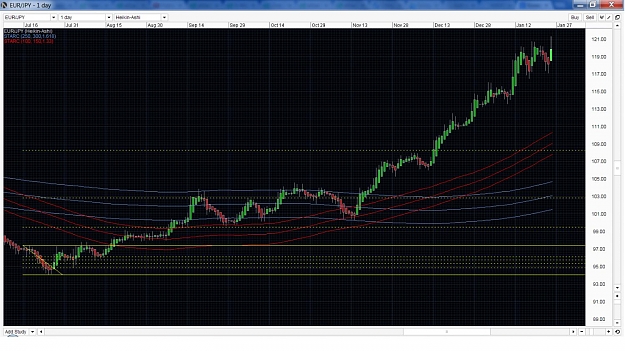
SELL
Sell is vice versa of BUY.

I wish a life time of success and happiness to everyone viewing this thread and I hope everyone will prosper well from this system.


*****IMPORTANT****
When you load the template, scroll all the way until you see the very beginning of the Center of Gravity indicator. This insures that the full 3000 bars of data needed are being provided
  • Post #2
  • Quote
  • Jan 24, 2013 12:41am Jan 24, 2013 12:41am
  •  ashur123
  • | Joined Dec 2008 | Status: Plant today. Harvest Tomorrow. | 159 Posts
Here is a video I put together real quick showing some more examples of my trades.

Inserted Video
  • Post #3
  • Quote
  • Jan 24, 2013 2:51am Jan 24, 2013 2:51am
  •  domenicfx
  • | Joined Sep 2012 | Status: Member | 10 Posts
very nice
  • Post #4
  • Quote
  • Jan 24, 2013 4:55am Jan 24, 2013 4:55am
  •  Jaquemate
  • Joined Nov 2010 | Status: Member | 498 Posts
Hi ashur123.
I like your idea.
I have some questions if you are pleasant to reply to me.

1. Could you post a template?. I dont understand center of gravity settings. If i put this settings COG is invisible at my chart.
2. What is Starc indicator?. Could you attached?.
3. Do you have any stadistical for comment?.

Good work mate.

Regards.
That which you give to others, life will return it in spades
  • Post #5
  • Quote
  • Jan 24, 2013 10:20am Jan 24, 2013 10:20am
  •  ashur123
  • | Joined Dec 2008 | Status: Plant today. Harvest Tomorrow. | 159 Posts
Quoting Jaquemate
Disliked
Hi ashur123.
I like your idea.
I have some questions if you are pleasant to reply to me.

1. Could you post a template?. I dont understand center of gravity settings. If i put this settings COG is invisible at my chart.
2. What is Starc indicator?. Could you attached?.
3. Do you have any stadistical for comment?.

Good work mate.

Regards.
Ignored
Hey Jacque, I just posted the template I use plus the center of gravity indicator. The STARC indicator come with the Oanda chart. For this system I strongly recommend you open a demo account with Oanda just to use their Heiken-Ashi chart and Starc bands. As for stats, I don't have much yet considering I took a very big loss before I discovered this system. I will keep updating this thread though so the stats will be coming in.
  • Post #6
  • Quote
  • Jan 24, 2013 10:20am Jan 24, 2013 10:20am
  •  ashur123
  • | Joined Dec 2008 | Status: Plant today. Harvest Tomorrow. | 159 Posts
Quoting domenicfx
Disliked
very nice
Ignored
thank you!
  • Post #7
  • Quote
  • Jan 24, 2013 10:39am Jan 24, 2013 10:39am
  •  ashur123
  • | Joined Dec 2008 | Status: Plant today. Harvest Tomorrow. | 159 Posts
Here is why I am in the SELL position of CAD/JPY. We went back to our last BUY signal and we used our fibonacci. Our fibonacci shows that the last Fibo line was hit recently. This is a strong indication that the market is looking to reverse. This point would have also been the take profit of our last Buy signal.
Attached Images (click to enlarge)
Click to Enlarge

Name: cadjpy.jpg
Size: 405 KB Click to Enlarge

Name: cadjpy3.jpg
Size: 474 KB Click to Enlarge

Name: cadjpy1.jpg
Size: 341 KB
  • Post #8
  • Quote
  • Jan 24, 2013 2:16pm Jan 24, 2013 2:16pm
  •  xixi
  • Joined Aug 2012 | Status: Member | 224 Posts
Thanks ashur123 for sharing your system!
It looks very promising!

I've just setup a template on MT4 and Oanda. The STARCs on those two platform look a bit different :-)
Is there any reason why you suggest Oanda chart?

Attached Image (click to enlarge)
Click to Enlarge

Name: 2013-01-24-6.jpg
Size: 112 KB


Attached Image (click to enlarge)
Click to Enlarge

Name: 2013-01-24-7.jpg
Size: 247 KB
  • Post #9
  • Quote
  • Jan 24, 2013 2:19pm Jan 24, 2013 2:19pm
  •  kristjantelve
  • | Joined Oct 2006 | Status: Member | 263 Posts
Hey there

Looks like nice system you have discovered (Y).
I have question thou: Why we canīt use MT4 STARC indicator and Heiken candels?

Regards

Kristjan
  • Post #10
  • Quote
  • Jan 24, 2013 6:46pm Jan 24, 2013 6:46pm
  •  ashur123
  • | Joined Dec 2008 | Status: Plant today. Harvest Tomorrow. | 159 Posts
Quoting xixi
Disliked
Thanks ashur123 for sharing your system!
It looks very promising!

I've just setup a template on MT4 and Oanda. The STARCs on those two platform look a bit different :-)
Is there any reason why you suggest Oanda chart?

Attachment 1123359

Attachment 1123363
Ignored
The reason I use Oanda is because I also use their Fibo retracement, which I like more than MT4, plus I prefer Oandas heiken-ashi candles. I guess it's a matter of preference. But depending on what setting's you use on MT4, it may give you different entry signals than it would have in Oanda.
  • Post #11
  • Quote
  • Jan 24, 2013 7:18pm Jan 24, 2013 7:18pm
  •  ashur123
  • | Joined Dec 2008 | Status: Plant today. Harvest Tomorrow. | 159 Posts
A quick look at EUR/JPY....

This system makes trading very very simple and allows you to have time to do so many other things. You only need to check the charts once a day.
Attached Image (click to enlarge)
Click to Enlarge

Name: EURJPY.jpg
Size: 458 KB
  • Post #12
  • Quote
  • Jan 24, 2013 10:32pm Jan 24, 2013 10:32pm
  •  xixi
  • Joined Aug 2012 | Status: Member | 224 Posts
Quoting ashur123
Disliked
The reason I use Oanda is because I also use their Fibo retracement, which I like more than MT4, plus I prefer Oandas heiken-ashi candles. I guess it's a matter of preference. But depending on what setting's you use on MT4, it may give you different entry signals than it would have in Oanda.
Ignored
Thanks ashur!
  • Post #13
  • Quote
  • Jan 24, 2013 10:46pm Jan 24, 2013 10:46pm
  •  xixi
  • Joined Aug 2012 | Status: Member | 224 Posts
Quoting ashur123
Disliked
A quick look at EUR/JPY....

This system makes trading very very simple and allows you to have time to do so many other things. You only need to check the charts once a day.
Ignored
Yeah, it's very simple.
Looks like price has already gone very far from the highest fibo level. Let's see if it breaks the highest low or not

Attached Image (click to enlarge)
Click to Enlarge

Name: 2013-01-25-1.jpg
Size: 224 KB
  • Post #14
  • Quote
  • Jan 24, 2013 11:16pm Jan 24, 2013 11:16pm
  •  ashur123
  • | Joined Dec 2008 | Status: Plant today. Harvest Tomorrow. | 159 Posts
Quoting xixi
Disliked
Yeah, it's very simple.
Looks like price has already gone very far from the highest fibo level. Let's see if it breaks the highest low or not

Attachment 1123559
Ignored
Exactly and look how far price is away from the Starc bands. It's been away from it for a while now, so it's yearning to go back to it! Be ready for some very nice profits.
  • Post #15
  • Quote
  • Jan 25, 2013 12:13am Jan 25, 2013 12:13am
  •  ashur123
  • | Joined Dec 2008 | Status: Plant today. Harvest Tomorrow. | 159 Posts
According to this system, price wants to drop down to the 1300 area for XAU/USD. As you can see from the pictures, there's a big chance that there may be a drop coming soon.
Attached Images (click to enlarge)
Click to Enlarge

Name: GOLD.jpg
Size: 389 KB Click to Enlarge

Name: GOLD 2.jpg
Size: 367 KB Click to Enlarge

Name: GOLD 3.jpg
Size: 265 KB
  • Post #16
  • Quote
  • Jan 25, 2013 12:35am Jan 25, 2013 12:35am
  •  xixi
  • Joined Aug 2012 | Status: Member | 224 Posts
Quoting ashur123
Disliked
According to this system, price wants to drop down to the 1300 area for XAU/USD. As you can see from the pictures, there's a big chance that there may be a drop coming soon.
Ignored
Hi ashur,

According to your system, is the point at white circle in the chart below the correct sell signal?

Attached Image (click to enlarge)
Click to Enlarge

Name: GOLD.jpg
Size: 369 KB
  • Post #17
  • Quote
  • Jan 25, 2013 1:01am Jan 25, 2013 1:01am
  •  ashur123
  • | Joined Dec 2008 | Status: Plant today. Harvest Tomorrow. | 159 Posts
No, there is a little red candle hiding after where you have circled. Here it is zoomed in...
Attached Image (click to enlarge)
Click to Enlarge

Name: gold4.jpg
Size: 345 KB
  • Post #18
  • Quote
  • Jan 25, 2013 1:47am Jan 25, 2013 1:47am
  •  xixi
  • Joined Aug 2012 | Status: Member | 224 Posts
Quoting ashur123
Disliked
No, there is a little red candle hiding after where you have circled. Here it is zoomed in...
Ignored
No, I assumed that present price is just as below.

Attached Image (click to enlarge)
Click to Enlarge

Name: gold4.jpg
Size: 201 KB
  • Post #19
  • Quote
  • Jan 25, 2013 5:34am Jan 25, 2013 5:34am
  •  campco
  • | Joined Jul 2009 | Status: Member | 132 Posts
Looks good to me! Thanks Ashur.
I'l defenitely try!
  • Post #20
  • Quote
  • Jan 25, 2013 2:25pm Jan 25, 2013 2:25pm
  •  ashur123
  • | Joined Dec 2008 | Status: Plant today. Harvest Tomorrow. | 159 Posts
Quick look at the EUR/GBP. We will wait for price to return to STARC bands if we want to enter a BUY on this one. There is still profit to be made.
Attached Images (click to enlarge)
Click to Enlarge

Name: EURGBP.jpg
Size: 364 KB Click to Enlarge

Name: EURGBP2.jpg
Size: 344 KB
  • Trading Systems
  • /
  • Lean Mean Money Making Machine
  • Reply to Thread
    • Page 1 23456 7
    • Page 1 234 7
0 traders viewing now
  • More
Top of Page
  • Facebook
  • Twitter
About FF
  • Mission
  • Products
  • User Guide
  • Media Kit
  • Blog
  • Contact
FF Products
  • Forums
  • Trades
  • Calendar
  • News
  • Market
  • Brokers
  • Trade Explorer
FF Website
  • Homepage
  • Search
  • Members
  • Report a Bug
Follow FF
  • Facebook
  • Twitter

FF Sister Sites:

  • Metals Mine
  • Energy EXCH
  • Crypto Craft

Forex Factory® is a brand of Fair Economy, Inc.

Terms of Service / ©2021