Hey guys,
First off, thanks for detailed replies, much appreciated.
I see exactly what you both mean with regards to copying and pasting the leg of AB, and extending this line into the future. Great stuff, thanks.
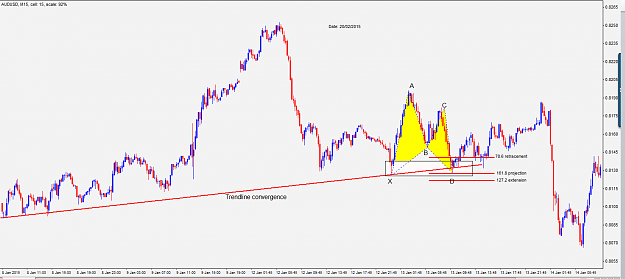
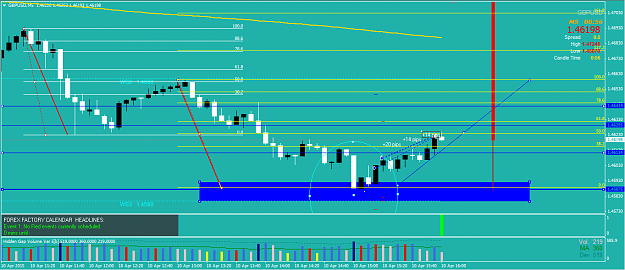
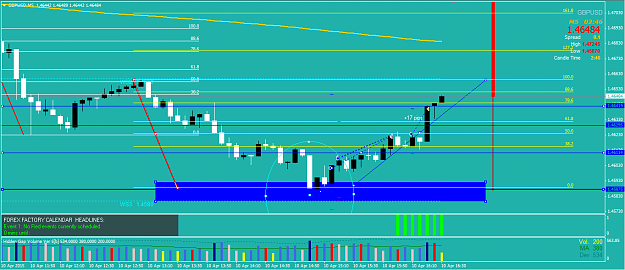
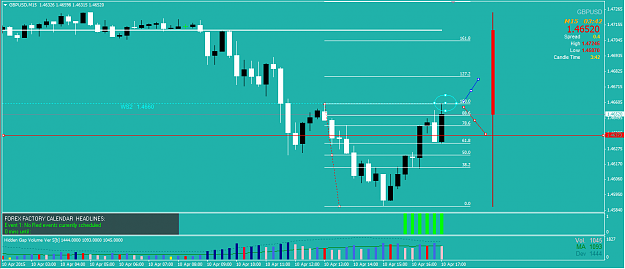
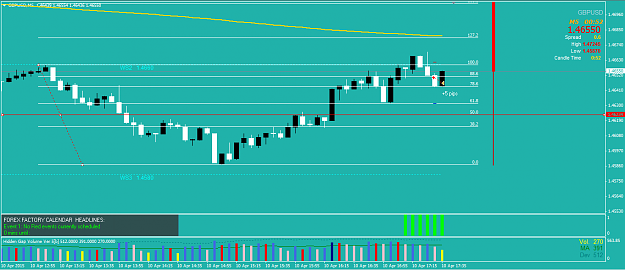
As a little experiment to see if I understand what you both are showing, here is, what I believe to be, a bullish Gartley pattern that worked out fantastically.
So, to begin with, we have the XA retracement of .618, great. Next step, I wanted to see how far price retraced from BC, this was also .618. Here is where I usually hit a wall! However, I think I may be seeing it more clearly now.
So, from this point I measured the BC projection, using the fib retracement tool – the most extreme numbers below 0.000 on your basic Fib tool, and it came out to a cool 161.8 projection. Ok, next step I measured the XA retracement to see where the 0.786 retracement landed. As I understand it should be part of the PRZ. As you can see, it was quite close. The next task, I loaded the extensions tool and found the 100.0 extension line up perfectly within the demand area. A nice AB=CD pattern.
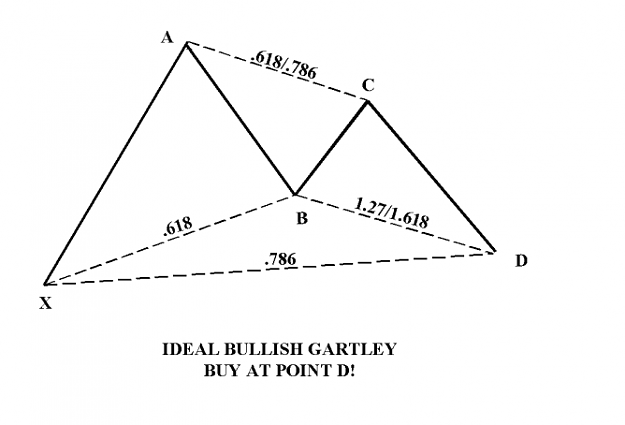
As per Scott Carney’s drawings (below), if the retracement of BC falls in at .618, we should look for a projection of 1.618, and we would only be looking for a 1.27 project if the BC retracement was .786.
Thanks
Aaron
First off, thanks for detailed replies, much appreciated.
I see exactly what you both mean with regards to copying and pasting the leg of AB, and extending this line into the future. Great stuff, thanks.
As a little experiment to see if I understand what you both are showing, here is, what I believe to be, a bullish Gartley pattern that worked out fantastically.
So, to begin with, we have the XA retracement of .618, great. Next step, I wanted to see how far price retraced from BC, this was also .618. Here is where I usually hit a wall! However, I think I may be seeing it more clearly now.
So, from this point I measured the BC projection, using the fib retracement tool – the most extreme numbers below 0.000 on your basic Fib tool, and it came out to a cool 161.8 projection. Ok, next step I measured the XA retracement to see where the 0.786 retracement landed. As I understand it should be part of the PRZ. As you can see, it was quite close. The next task, I loaded the extensions tool and found the 100.0 extension line up perfectly within the demand area. A nice AB=CD pattern.
As per Scott Carney’s drawings (below), if the retracement of BC falls in at .618, we should look for a projection of 1.618, and we would only be looking for a 1.27 project if the BC retracement was .786.
Thanks
Aaron
Attached Image(s) (click to enlarge)