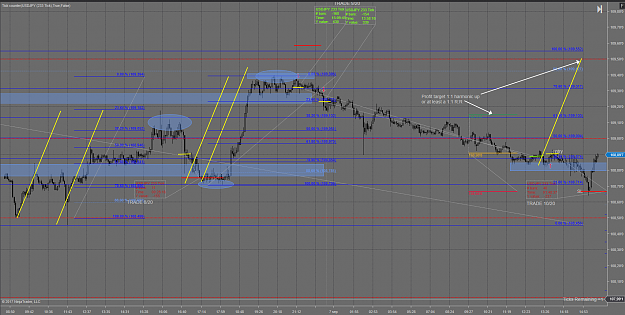
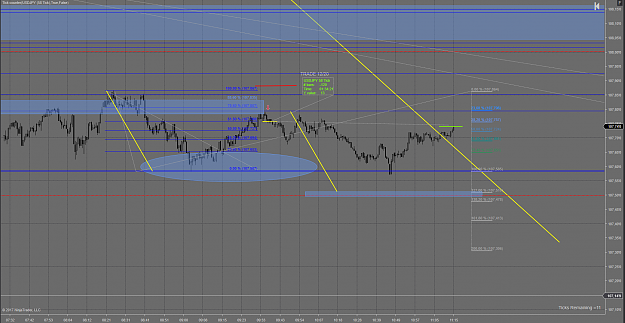
Trade 9 of 20 (7 Sept 2017)
USDJPY short
Expectation:
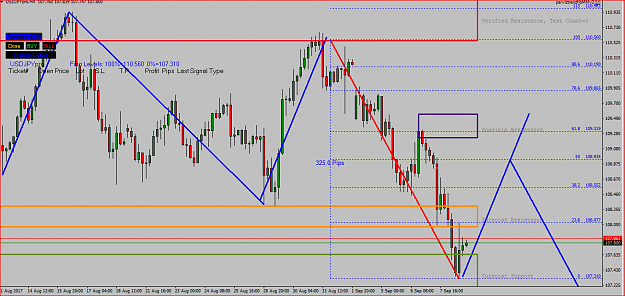
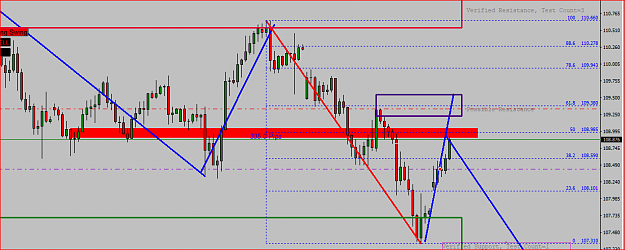
Looking at structure on the 15M chart, long term expectation could be NSL
Overall trend is/was bearish, price came into a major support zone and found some strength to the upside. Yesterday decent move by the bulls, came into 78.6% correction zone of the longer term swing.
Trading the longer term expectation of NSL, keeping in mind that orderflow could be changing to the upside and price might not make a new NSL.
Because price retraced deep, I had a good R:R, even if price would not make it past the large support zone. And I expected I would at least be able to protect the trade and give it a good chance to meet its target.
Strength assessment:
Good bearish projection running into the long term support zone
Impulse long term strong first, then weakening when reaching support zone
Depth: deep retracement long term, with strong bullish impulse
Bears long term not looking very strong at point of entry.
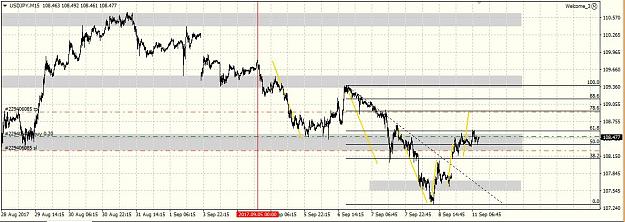
Short term seemed like bulls reached a point of exhaustion, not able to take price higher. Fib extension of downward swing between 138.2 and 161.8 indicating extreme exhaustion. I’m very new to using fib extension this way so not sure if I’m doing it right. Anyway, an intraday 1:1 harmonic completion was achieved, also indicating possible exhaustion.
Bears were pushing down on the 78.6 level (volume candles).
Strength of entry signal:
FIB: Took entry at 78.6% of longer term
STRUCTURE: good longer term structure to the left
HARMONIC: intraday 1:1 harmonic completion of an ABCD pattern
--> SOS3 (minimum SOS2 required according to trading plan)
Rotation candle:
Good rotation candle from small supply zone (indicated)
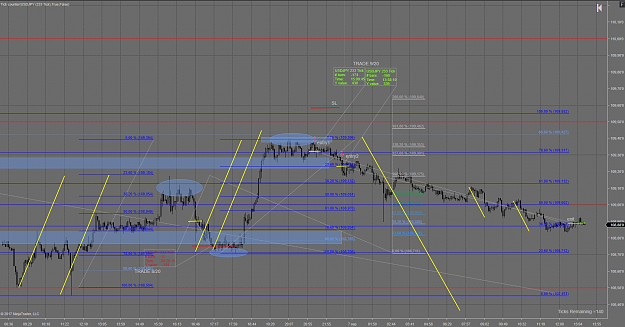
Trade management:
Put SL above long term swing
Entered with reduced risk (0.08 lot, about 16 euros), also because I was trading into a support zone (indicated)
When price got past that zone, I added a bit more to the trade (0.04 lot) at the retest of the zone, expecting it to become resistance.
Total risk of the two trades was about 25 euros.
Profit target ideally would be a 1:1 long term harmonic down, but I was aware there would be a lot of obstacles so that was maybe not realistic.
Obstacles:
- Golden zone of last swing up
- 61.8% of total swing up (AD of ABCD pattern)
- Long term support zone
So keeping realistic goal of 61.8% correction of AD of the pattern. That would give me at least a 1:1 return on the risk.
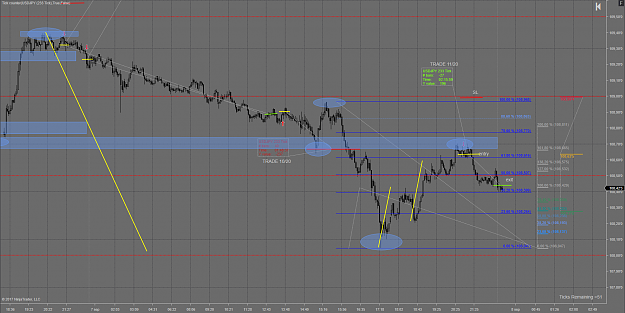
Went to BE when reaching 38.2% correction of AD leg. When price reached 50% correction, I protected above the immediate structure, at 109.07.
Bears were weakening in immediate (deeper correction, less impulse, less projection) when getting in the vicinity of the 61.8% of AD, where also confluence with 78.6% of CD leg, and also previous support zone (indicated).
Also looking at the intraday bearish move, it had weak impulse so not expecting it to get any further.
Started trailing aggressively on immediate structure + 38.2-50% trailing rule on immediate swings, making sure I would at least get a 1:1 R:R out of it.
Summary:
Risk: two trades, total risk -25 euro
Initial profit target: +42 euro (61.8% of AD of pattern)
Actual profit: +36.5 euro
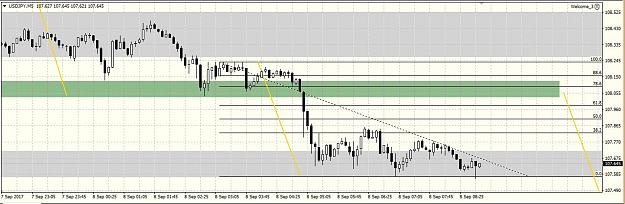
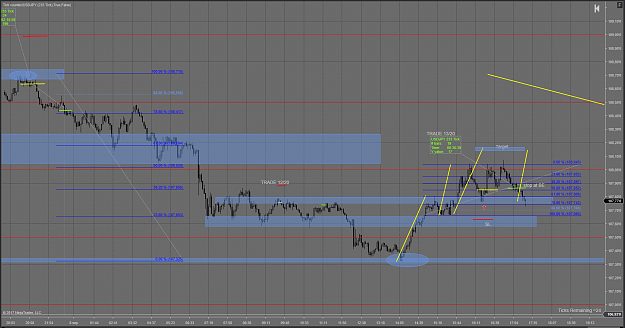
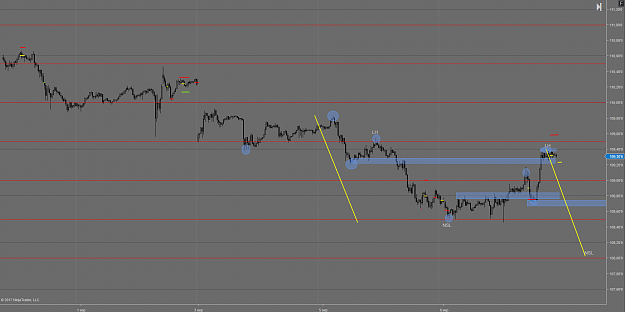
15M chart:
USDJPY short
Expectation:
Looking at structure on the 15M chart, long term expectation could be NSL
Overall trend is/was bearish, price came into a major support zone and found some strength to the upside. Yesterday decent move by the bulls, came into 78.6% correction zone of the longer term swing.
Trading the longer term expectation of NSL, keeping in mind that orderflow could be changing to the upside and price might not make a new NSL.
Because price retraced deep, I had a good R:R, even if price would not make it past the large support zone. And I expected I would at least be able to protect the trade and give it a good chance to meet its target.
Strength assessment:
Good bearish projection running into the long term support zone
Impulse long term strong first, then weakening when reaching support zone
Depth: deep retracement long term, with strong bullish impulse
Bears long term not looking very strong at point of entry.
Short term seemed like bulls reached a point of exhaustion, not able to take price higher. Fib extension of downward swing between 138.2 and 161.8 indicating extreme exhaustion. I’m very new to using fib extension this way so not sure if I’m doing it right. Anyway, an intraday 1:1 harmonic completion was achieved, also indicating possible exhaustion.
Bears were pushing down on the 78.6 level (volume candles).
Strength of entry signal:
FIB: Took entry at 78.6% of longer term
STRUCTURE: good longer term structure to the left
HARMONIC: intraday 1:1 harmonic completion of an ABCD pattern
--> SOS3 (minimum SOS2 required according to trading plan)
Rotation candle:
Good rotation candle from small supply zone (indicated)
Trade management:
Put SL above long term swing
Entered with reduced risk (0.08 lot, about 16 euros), also because I was trading into a support zone (indicated)
When price got past that zone, I added a bit more to the trade (0.04 lot) at the retest of the zone, expecting it to become resistance.
Total risk of the two trades was about 25 euros.
Profit target ideally would be a 1:1 long term harmonic down, but I was aware there would be a lot of obstacles so that was maybe not realistic.
Obstacles:
- Golden zone of last swing up
- 61.8% of total swing up (AD of ABCD pattern)
- Long term support zone
So keeping realistic goal of 61.8% correction of AD of the pattern. That would give me at least a 1:1 return on the risk.
Went to BE when reaching 38.2% correction of AD leg. When price reached 50% correction, I protected above the immediate structure, at 109.07.
Bears were weakening in immediate (deeper correction, less impulse, less projection) when getting in the vicinity of the 61.8% of AD, where also confluence with 78.6% of CD leg, and also previous support zone (indicated).
Also looking at the intraday bearish move, it had weak impulse so not expecting it to get any further.
Started trailing aggressively on immediate structure + 38.2-50% trailing rule on immediate swings, making sure I would at least get a 1:1 R:R out of it.
Summary:
Risk: two trades, total risk -25 euro
Initial profit target: +42 euro (61.8% of AD of pattern)
Actual profit: +36.5 euro
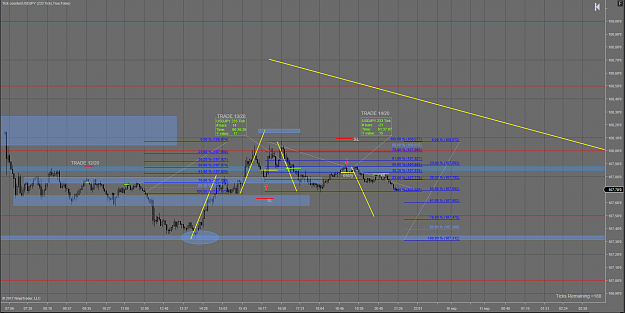
Attached Image (click to enlarge)
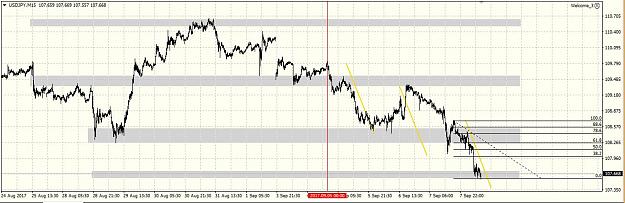
15M chart:
Attached Image (click to enlarge)
1