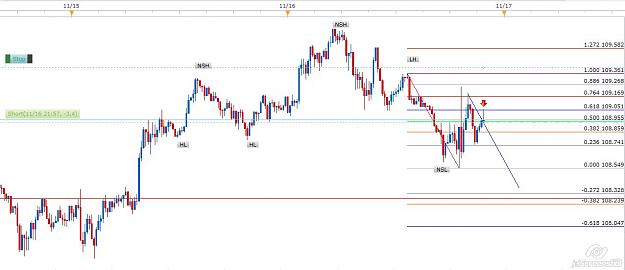
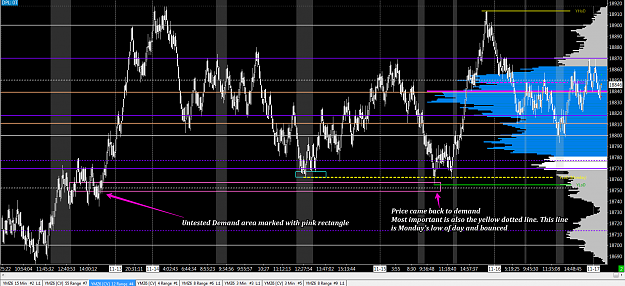
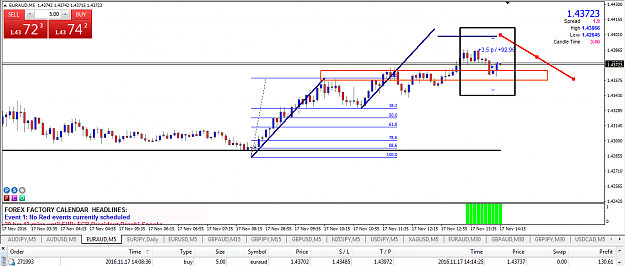
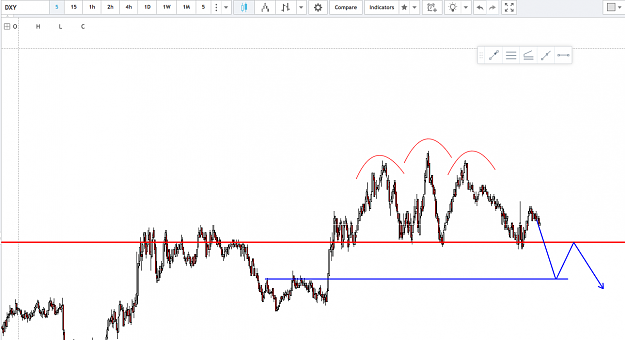
An interesting note on the 5Min USD Currency Index (I use this also as a tool to help with trades since the pairs I trade are all USD based, they have a direct coorelation to the movements of this index and you can determine the strength and weakness of a pair by comparing them).
It appears the USD strength is breaking down on the short term -
On this chart, there seems to be a head and shoulders pattern that may be near completion, if it breaks below the red line (area) and pulls back, it might be a great long entry zone for EURUSD, or a short for USDJPY for a nice move.
Using Mr. Pip's methodology, at the break of structure wait for a pullback (possibly to the red area zone/confluence with fibs) and trade in the direction of the move from there.
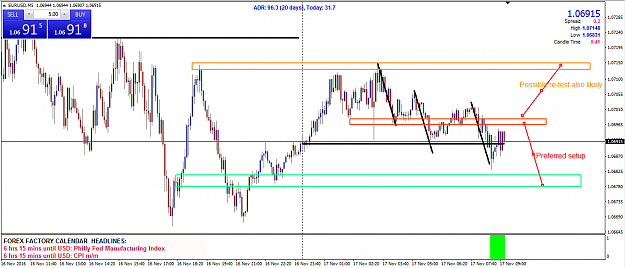
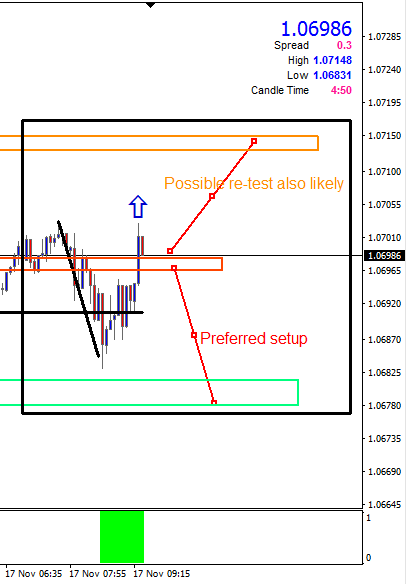
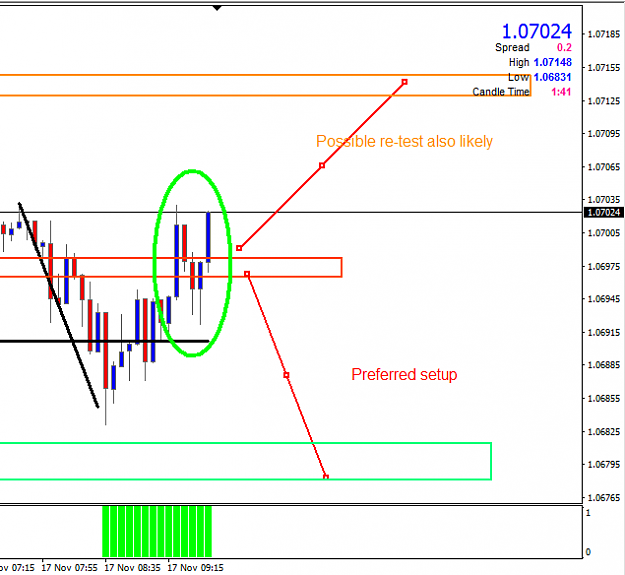
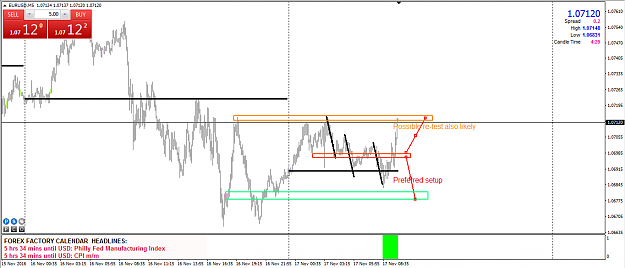
Attached Image (click to enlarge)
1