• Home
  • Forums
  • Trades
  • News
  • Calendar
  • Market
  • Brokers
  • Login
  • Join
  • User/Email: Password:
  • 2:24am
Menu
  • Forums
  • Trades
  • News
  • Calendar
  • Market
  • Brokers
  • Login
  • Join
  • 2:24am
Sister Sites
  • Metals Mine
  • Energy EXCH
  • Crypto Craft

Options

Bookmark Thread

First Page First Unread Last Page Last Post

Print Thread

Similar Threads

Which FX Trading Course/System is Good for newbies? 41 replies

Help for Newbies. What can you learn on Forex Factory? 42 replies

No Help for newbies at Forex-tsd :C 8 replies

Price Action for Newbies HELP WANTED! 2 replies

HELP THE NEWBIES!!!!! 2 replies

  • Trading Discussion
  • /
  • Reply to Thread
  • Subscribe
  • 53
Attachments: Help for Newbies (Discussion Thread)
Exit Attachments
Tags: Help for Newbies (Discussion Thread)
Cancel

Help for Newbies (Discussion Thread)

  • Last Post
  •  
  • 1 Page 23456 34
  • 1 Page 234 34
  •  
  • Post #21
  • Quote
  • Aug 9, 2007 2:28pm Aug 9, 2007 2:28pm
  •  radi164
  • | Joined Apr 2007 | Status: Member | 20 Posts
hi for MR FM AND EVERY BODY HELP THE NEWBIES.
i thank you for help but after i read AL . i feel I'm in middle and i cant decide any indicators i will use i know i should test them by demo account and i was do .with most i loose .i won with the news . but i hear many say be aware from the news trade . are can you help and tell me why be aware. thank you
 
 
  • Post #22
  • Quote
  • Aug 10, 2007 5:10am Aug 10, 2007 5:10am
  •  PeterFM
  • Joined Apr 2006 | Status: Suaviter in modo, fortiter in re | 1,851 Posts
Quoting radi164
Disliked
hi for MR FM AND EVERY BODY HELP THE NEWBIES.
i thank you for help but after i read AL . i feel I'm in middle and i cant decide any indicators i will use i know i should test them by demo account and i was do .with most i loose .i won with the news . but i hear many say be aware from the news trade . are can you help and tell me why be aware. thank you
Ignored
First, I'd like to welcome you onboard.

OK, let's deal with your questions.

  1. i feel I'm in middle and i cant decide any indicators i will use i know i should test them by demo account and i was do .with most i loose...I would first say that you have to decide on which time-frame you plan to trade on. If you've read all my posts, you'll know that I recommend that you start on the daily charts. I would also say read all of the posts in James's Price Action thread. If you have started to demo that is a good thing. Go back and re-read my Account Size and Leverage posts in the Newbies Thread and apply those rules. For further advice on Money Management read Diallist's Money Management thread, also found in the Beginner's Section.

    At this stage you are learning to trade, not trying to make money. It's very important to master Money Management survival techniques, as this will develop good trading practices that will stand you in good stead when you go live in a few months time.

    With respect to indicators, all I can tell you is that I don't use any apart from a couple of long-term Moving Averages (MAs) to guide me as to POSSIBLE Support and Resistance (S/R) areas when price moves back away from the main trend. Once you have an idea of Price Action, and learn to wait and watch for it at certain key S/R areas, you will be on your way to developing a feel for the market, rather than blindly following a complex set of indicators that can only give you a best guess at what might be happening.
  2. i won with the news . but i hear many say be aware from the news trade . are can you help and tell me why be aware. thank you...As a new trader there are many things that you need to learn to understand what drives the market, both short-term and long-term. Trading the news, for a newcomer, is little more than gambling, and if you have won this early in your trading career it would be fair to say it was more likely to have been luck. News trading is for experienced traders, who have a good grasp of how to read, and understand, all the data that can effect price movements at news time. Even then they may use sophisticated entry and exit techniques to minimise risk. Many brokers are known to widen their spreads to such a point that it can be hard to make consistent trading rules work when trying to gain those few pips on a regular basis. This is not cheating by the brokers, it is a simple fact of the market. Add to this a lack of knowledge about currency fundamentals and you will be guessing most of the time. This is a bad thing.

Read the stuff I have indicated above, start on daily charts with some longer EMAs (Exponential Moving Averages) and learn Money Management.

Try the 200 EMA for a start, and just stare at the daily charts for a while. Get to understand important things like Support and Resistance, which are easier to see on the daily charts, and how price reacts around these areas.

Ask questions, we're here to help


  • Post #23
  • Quote
  • Aug 21, 2007 2:56pm Aug 21, 2007 2:56pm
  •  Maxpip
  • | Joined Jul 2007 | Status: Member | 5 Posts
The last post in your thread is quite funny....I'll remember that sense of humour is one of the most essential survival tools in FX.
I guess there is allways a bigger picture.

What you have put on this thread is really good stuff imho. Thanks for that its very insightful, understandable and I can relate to almost everything as far as my, to date still brief, experience allows me to follow.
The way you set it up also shows that you have a very systematic and thorough approach to it. No doubt you are gonna be a winner in this (irrespective of the little mishap now) and am trying to really take your advice in.

Quite a carnage in the last days and right now I fail to see any system to the movements. Not that I head great insight before but now its like tapping in the dark.
But I think this is a great time and opportunity to see how markets work on a deeper level and the very fundamental and powerful drivers of currency movements should be revealing themselves and may be the new long term trend, now that all this hot air is going.

Cheers
 
 
  • Post #24
  • Quote
  • Aug 21, 2007 3:09pm Aug 21, 2007 3:09pm
  •  PeterFM
  • Joined Apr 2006 | Status: Suaviter in modo, fortiter in re | 1,851 Posts
Quoting Maxpip
Disliked
The last post in your thread is quite funny....I'll remember that sense of humour is one of the most essential survival tools in FX.
I guess there is allways a bigger picture.

What you have put on this thread is really good stuff imho. Thanks for that its very insightful, understandable and I can relate to almost everything as far as my, to date still brief, experience allows me to follow.
The way you set it up also shows that you have a very systematic and thorough approach to it. No doubt you are gonna be a winner in this (irrespective of the little mishap now) and am trying to really take your advice in.

Quite a carnage in the last days and right now I fail to see any system to the movements. Not that I head great insight before but now its like tapping in the dark.
But I think this is a great time and opportunity to see how markets work on a deeper level and the very fundamental and powerful drivers of currency movements should be revealing themselves and may be the new long term trend, now that all this hot air is going.

Cheers
Ignored
I'm glad to see my mistake hasn't dented your opinion of the thread's usefulness.
I would hope the readers will take the lesson I've learnt to heart. If you survive the first few months, as a trader, that's when complacency can set in.
I've been punished by the market. Now I have to make sure it doesn't happen again. If I'd been trading big money I expect I would have been more cautious. Learning live with nano lots can be a disadvantage in that the sums involved don't seem threatening, but let me assure anyone reading this that it hurt. I'd grown my account by nearly 600% from the lowest point it had hit early in the year, and to see that go in about a week was soul-destroying.
Thanks for your input
 
 
  • Post #25
  • Quote
  • Aug 24, 2007 12:07pm Aug 24, 2007 12:07pm
  •  saskgui
  • | Joined Aug 2007 | Status: Member | 193 Posts
Hey Peter.

I have ready your thread and it is good stuff, please keep up with the good work. I am currently reading through "Trading in the Zone" and it is as good as i was led to believe. I just finished the first chapter and i am making notes to help me implement this line of thinking.

I am sorry to hear about your recent losses. I am somewhat dismayed that people above me are still learning such hard lessons. I kinda hoped it would get easier as you went on. However since you were capable of trading up your account in earlier this year i am certain you will do it again. It is just a matter of time and once you accept the loss and the discipline i doubt you will give this much back to the market again.
 
 
  • Post #26
  • Quote
  • Aug 24, 2007 1:17pm Aug 24, 2007 1:17pm
  •  PeterFM
  • Joined Apr 2006 | Status: Suaviter in modo, fortiter in re | 1,851 Posts
Quoting saskgui
Disliked
Hey Peter.

I have ready your thread and it is good stuff, please keep up with the good work. I am currently reading through "Trading in the Zone" and it is as good as i was led to believe. I just finished the first chapter and i am making notes to help me implement this line of thinking.
Ignored
Excellent book, and got my trading head on right in the early days.
Quote
Disliked
I am sorry to hear about your recent losses. I am somewhat dismayed that people above me are still learning such hard lessons. I kinda hoped it would get easier as you went on.
It should, as long as you don't get complacent. Don't put too many of us on pedestals, many of us are still on some part of the learning curve. I'd dealt with method (at least found one that suited me), kept my trade risk low despite trading multiple pairs, just got carried away with the success I was having. Ego will be the subject of my next post
Quote
Disliked
However since you were capable of trading up your account in earlier this year i am certain you will do it again. It is just a matter of time and once you accept the loss and the discipline i doubt you will give this much back to the market again.
Oh, I've accepted the loss, and it's taught me about discipline, that's for sure.
And no, the market will never do this to me again, or should I say I won't let the Complacent Trader do this to me again
 
 
  • Post #27
  • Quote
  • Aug 28, 2007 4:43pm Aug 28, 2007 4:43pm
  •  omsai
  • | Joined Aug 2007 | Status: Member | 9 Posts
Very, very noble thought, my friend. Keep it up. Some day I too will follow your foot prints indeed.
Omsai
Peace. May God be with you.
 
 
  • Post #28
  • Quote
  • Aug 28, 2007 5:59pm Aug 28, 2007 5:59pm
  •  omsai
  • | Joined Aug 2007 | Status: Member | 9 Posts
Hello Friend,
I am going through your thread and it is quite interesting with lots of experience based solid knowledge. Now, coming back to your posts on page 01, I have watched the chart as you intend to and it is clear that it is in downtrend. The last bar is around 240.00 levels(approx.). Now, please come to your next page/post 14, here the Blue Box shows the price around 238.65 to 239.95, meaning the market had fallen further and the date was 7th June. Further, I observe there are NO INDICATORS on the chart, not even the simple pivot levels! Then it baffles me that how did you arrive at the decision to GO LONG!? Which thing told you that the price has bottomed out? It is just that I would like to learn from you this art of understanding the price action. I may add that I am a newbie and have to learn a lot from you 'Gurus'. Therefore, if my question looks like childish affair, be patient and kindly teach me. I am willing to learn.
Thanks.
Omsai
Peace. May God be with you.
 
 
  • Post #29
  • Quote
  • Aug 28, 2007 7:55pm Aug 28, 2007 7:55pm
  •  hanover
  • Joined Sep 2006 | Status: ... | 8,092 Posts
Quoting omsai
Disliked
Hello Friend,
I am going through your thread and it is quite interesting with lots of experience based solid knowledge.........I am willing to learn.
Thanks.
Omsai
Peace. May God be with you.
Ignored
Omsai, welcome to the FF forum.

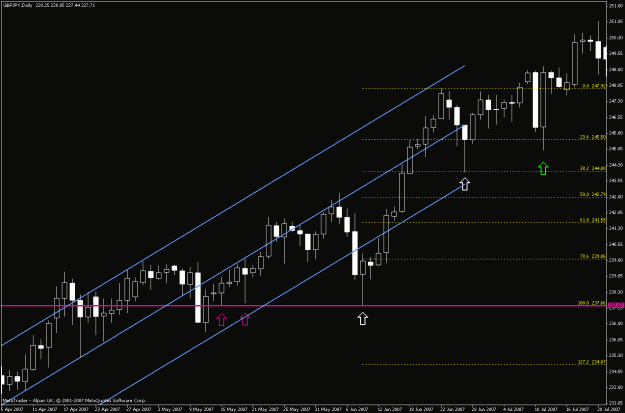
I can not speak for Peter, but here is why I would likely go long in the blue boxes of the post that you refer to. I have redrawn the same chart, highlighting the same two points with white arrows.

1. The overall trend is upward (as shown by the slope of the blue channel). If one follows the maxim “trade with the trend”, then one would only be taking long trades in this situation. The reasoning behind this is that in an uptrend, all of the upward moves are longer than the downward ones, hence the probability of profit is greater.

2. Price is “oversold” in relation to the channel. In other words, it has “pulled back” below the median line – in the case of the first arrow, significantly so. In the case of the second arrow, it has pulled back exactly 38.2% as shown by the yellow Fibonacci (Fibo) retracement, which is drawn between the previous swing high and low. In a strong or prolonged trend, pullbacks (or “corrections”) can be the result of traders taking profit, after which the trend resumes again.

3. This is the key point: The two arrowed candles are “hammer candles”, because of the long lower “wicks”. James16 tends to draw his charts using bars, and he calls these “pin bars”. The long lower wick means that price has fallen significantly, and then risen significantly in the same daily candle, pointing to a significant shift in momentum in a single period (day). If we were to look at the candles in a smaller timeframe (e.g. hourly), we would see this action, down and then up. Many traders use these “pin bars” to time their entries, i.e. enter on the candle immediately following, or when the pin bar high (for a long trade) has been exceeded. If enough traders think and act in the same way, it can have the effect of altering the balance of supply and demand, and hence drive the market accordingly (this is sometimes referred to as "self fulfilling prophecy").

The pin bar at the first white arrow also coincides with support shown by the pink line and arrows. In itself, this may not be hugely significant, but every little bit of supporting evidence enhances the probability of a bounce (back upward in this case).

I suggest that you read the James16 chart thread, for more detailed info on pin bars: http://www.forexfactory.com/showthread.php?t=2331

The candle at the green arrow is an “engulfing candle” or “outside bar”. Notice how it completely engulfs the previous candle. If we were to combine the two candles, we would get a similar concept, i.e. downward movement, followed by a significant shift upward. The three candles following the engulfing candle are a correction, perhaps representing some profit taking, after which the uptrend resumes at the right of the chart.

With some practise, it is possible to read this kind of “price action”. Having a lot of indicators on your charts is not necessarily beneficial.

Good luck with your trading.

David
Attached Image (click to enlarge)
Click to Enlarge

Name: gbpjpy example.gif
Size: 21 KB
 
 
  • Post #30
  • Quote
  • Edited 9:07pm Aug 28, 2007 8:38pm | Edited 9:07pm
  •  hanover
  • Joined Sep 2006 | Status: ... | 8,092 Posts
I’ve re-posted the chart with a few more arrows, to illustrate some additional points.

The yellow line and arrows highlight how resistance can sometimes later become support. Notice how the candle at the red arrow bounces off the support line.

The candles at the blue arrows are “bearish engulfing”. Engulfing candles can sometimes trigger a temporary change of direction, as these examples indicate. In the second example, the two candles between the red and blue are “spinning tops” and represent indecision, which can precede a reversal, and the blue arrowed candle confirms this. When price breaks below the yellow support line, the downward “collapse” is rapid. In general, the stronger the support/resistance line (i.e. more candles touching it), the greater the probability of a decent breakout.

A large candle at the end of a run can sometimes point to impending exhaustion of a trend, and a possible reversal, more so if accompanied by unusually high volume. The red arrowed candle being a case in point. [Note: volume by itself is not necessarily reliable; because forex is not a centralized exchange, all you are seeing is your own broker’s volume.]

Technical analysis is not a precise science. You will see plenty of examples where the patterns I’ve just noted don’t cause the expected outcome. However, the greater the weight of collective evidence (“confluence”), the higher the probability of obtaining the expected result. In the above example, exhaustion candle + spinning tops + bearish engulfing candle + deceleration of trend (slope of green lines) + the big bear candle (orange arrow) + overboughtness in last move (above blue median line) point to a possible reversal. Each element in itself is inconclusive, but in this case their collective weight ultimately turns out to be significant.

Of course it's very easy to annotate charts in hindsight!

David
Attached Image (click to enlarge)
Click to Enlarge

Name: gbpjpy example add-on.gif
Size: 23 KB
 
 
  • Post #31
  • Quote
  • Aug 28, 2007 8:57pm Aug 28, 2007 8:57pm
  •  hanover
  • Joined Sep 2006 | Status: ... | 8,092 Posts
Couldn't resist making one further point.....

Note how the deceleration in the upward trend reflects itself in all of: the slope in the green lines drawn through the swing highs; the slope of the blue regression channels; and the divergence in the MACD histogram.

The fact that divergences are the result of decelerations in the price action supports the idea that "divergence is a symptom, not a cause".

David
Attached Image (click to enlarge)
Click to Enlarge

Name: gbpjpy example divergence.gif
Size: 25 KB
 
 
  • Post #32
  • Quote
  • Aug 29, 2007 3:39pm Aug 29, 2007 3:39pm
  •  PeterFM
  • Joined Apr 2006 | Status: Suaviter in modo, fortiter in re | 1,851 Posts
Quoting omsai
Disliked
Further, I observe there are NO INDICATORS on the chart, not even the simple pivot levels! Then it baffles me that how did you arrive at the decision to GO LONG!? Which thing told you that the price has bottomed out? It is just that I would like to learn from you this art of understanding the price action.
Thanks.
Omsai
Peace. May God be with you.
Ignored
Hanover (thanks) has given you a far more informative response than I will. It's very apparent that his grasp of the wider subtleties of trading is far greater than my own. So, for what it's worth, here is why I took those trades.

My approach to trading is as simple as I can make it. It relies on visual interpretations of price action, very much as explained in James's thread. There are no indicators on the chart as those images were done for clarity, rather than to demonstrate my method.

As simple as it is, my method is based on many hours of chart watching and combining this with a basic belief in the value of trading with the trend.

If you look at the movement of price during those few days, it's clear that there were opportunities to go long or short many times, and, if you were skillful, pick up 100s of pips in either direction. I have neither the analytical skills, nor the desire, to sit at the computer for hours trying to catch every move. I've done this in the past and found the whole exercise tiresome, and, at times, frustrating.

In the end I decided to change two things. I've mentioned both of these in earlier posts. First, never place market orders. Second, only trade with the trend (as shown on the daily). I use two EMAs (Exponential Moving Averages) purely for trend confirmation, and to be honest I probably don't even need them. I use PSAR to guide me as to possible locations for Buy/Sell orders, which are placed above/below current price and wait for the trend to resume.

End of story.

Hanover's way is a true Technical Analyst's (TA) way of working. Mine is the lazy man's way. Neither is right. Neither is wrong. Each trader must find what works for him, and what parts of his own individual skills can be brought to the table.

As a final answer to your question -- Which thing told you that the price has bottomed out? -- nothing told me that price had bottomed, it just so happened that when it did, and price resumed its upward course, I was already there waiting for it to hit my buy order. If price had kept dropping I would have followed it down with my waiting order, or maybe added some smaller lots at the lower levels. This is a defensive measure in case of a small return to the trend which proves to be a false move.

Nothing clever, nothing magical. Just time spent finding MY method, looking at how price reacts around certain Support and resistance areas, and patience whilst waiting for the trend to re-establish itself.

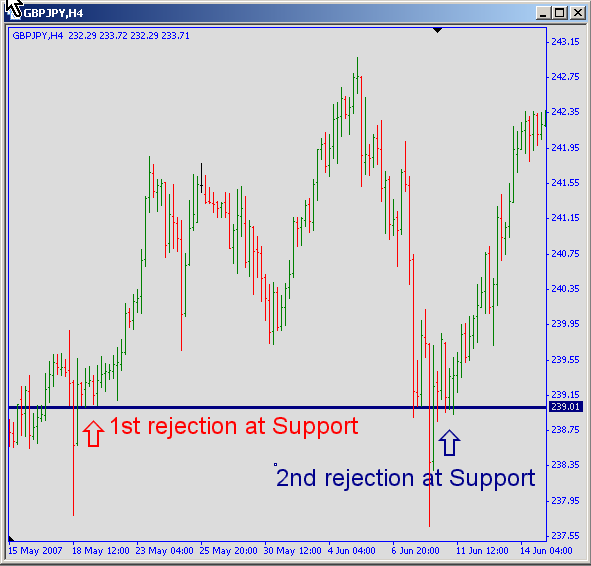
Another factor that caused me to add a small additional trade that week was how price was reacting to Support and Resistance when I viewed the 4hr chart. You can see what I mean in the attached image. This, like most things in FX, isn't guaranteed to work every time, but was good enough confirmation for me in the context of those trades.
Attached Image
 
 
  • Post #33
  • Quote
  • Aug 29, 2007 4:49pm Aug 29, 2007 4:49pm
  •  omsai
  • | Joined Aug 2007 | Status: Member | 9 Posts
Hello Friends (Hanover & PeterFM),
It is most kind on your part to explain the things in a manner to make it understandable. Ofcourse, for that, one has to develop a keen eye and understanding of each bar/candle. That is my shortcoming yet. I should have looked deeply to understand that what made 'Peter' to go LONG at that particular level. I stand corrected and am grateful for your able guidance. I will look up 'James16' thread to improve my grasp on price action. I hope to receive your support in future too.
Omsai
Peace. May God be with you.
 
 
  • Post #34
  • Quote
  • Sep 25, 2007 7:21am Sep 25, 2007 7:21am
  •  Bakuli
  • | Joined Jul 2007 | Status: Learner | 1,363 Posts
Hi Peter

I just only discovered your thread and may I say what a thoughtful thing you are doing here to help us newbies. I have read through your thread and will re-read it again later as I find it so helpful. Yes I have made many mistakes as mentioned in your thread and have lost big time trading the shorter time frames. I nearly gave up trading after losing most of my hard earned savings and was feeling quite down because of my stupidity in venturing into something that I knew very little about. I am slowly learning and getting 'wiser' each day as I come across really helpful contributions from people like you who unselfishly give their time to help others.
Many thanks.
 
 
  • Post #35
  • Quote
  • Sep 25, 2007 7:33am Sep 25, 2007 7:33am
  •  PeterFM
  • Joined Apr 2006 | Status: Suaviter in modo, fortiter in re | 1,851 Posts
Quoting Bakuli
Disliked
Hi Peter

I just only discovered your thread and may I say what a thoughtful thing you are doing here to help us newbies. I have read through your thread and will re-read it again later as I find it so helpful. Yes I have made many mistakes as mentioned in your thread and have lost big time trading the shorter time frames. I nearly gave up trading after losing most of my hard earned savings and was feeling quite down because of my stupidity in venturing into something that I knew very little about. I am slowly learning and getting 'wiser' each day as I come across really helpful contributions from people like you who unselfishly give their time to help others.
Many thanks.
Ignored
It is a long journey, but with patience and study, you have as much chance as anyone here. Just keep reading until you find something that works for you, and then stick to the rules. All the systems on FF have potential, it just takes a while to understand their subtleties.
Good trading, and thanks
 
 
  • Post #36
  • Quote
  • Sep 25, 2007 4:56pm Sep 25, 2007 4:56pm
  •  clockwork71
  • | Commercial Member | Joined May 2007 | 7,584 Posts
Quoting omsai
Disliked
Hello Friends (Hanover & PeterFM),
It is most kind on your part to explain the things in a manner to make it understandable. Ofcourse, for that, one has to develop a keen eye and understanding of each bar/candle. That is my shortcoming yet. I should have looked deeply to understand that what made 'Peter' to go LONG at that particular level. I stand corrected and am grateful for your able guidance. I will look up 'James16' thread to improve my grasp on price action. I hope to receive your support in future too.
Omsai
Peace. May God be with you.
Ignored
Omsai -

I highly recommend the James16 stuff. I was having problems before I found it. Also, he shows how to define support and resistance. S/R lines and formations in themselves can be deadly accurate at times.

Read through that thread, you will see a lot of information, but it is worth it. My advice is take one formation at a time. (HE goes through something called a pinbar, I would start there. Trade only pinbars for a while. Once you are good at them, try something else....like an Outside Bullish Bar or something.....)

Best of luck to you.

Clockwork71
 
 
  • Post #37
  • Quote
  • Sep 25, 2007 5:00pm Sep 25, 2007 5:00pm
  •  clockwork71
  • | Commercial Member | Joined May 2007 | 7,584 Posts
Quoting Bakuli
Disliked
Hi Peter

I just only discovered your thread and may I say what a thoughtful thing you are doing here to help us newbies. I have read through your thread and will re-read it again later as I find it so helpful. Yes I have made many mistakes as mentioned in your thread and have lost big time trading the shorter time frames. I nearly gave up trading after losing most of my hard earned savings and was feeling quite down because of my stupidity in venturing into something that I knew very little about. I am slowly learning and getting 'wiser' each day as I come across really helpful contributions from people like you who unselfishly give their time to help others.
Many thanks.
Ignored
In my opinion, shorter time frames will get you killed.

Too many of us are lured into this by the thought of making $12,000 in minutes. Not many of us realize you could also lose that money in the same time.

Here's something that might interest you:

Since I moved to 4 hour and daily charts, I have about a 80% win ratio. Almost all of the other 20% are trades I took from 15 minute charts. (Or, as I like to call them, lapses of discipline.)

Keep your head up. The day you realize that you really do have a chance, it will change you thinking forever.

Clockwork71

PS - Sorry for butting in Peter, I will go back to my cave.
 
 
  • Post #38
  • Quote
  • Sep 25, 2007 5:05pm Sep 25, 2007 5:05pm
  •  PeterFM
  • Joined Apr 2006 | Status: Suaviter in modo, fortiter in re | 1,851 Posts
Quoting clockwork71
Disliked
Clockwork71

PS - Sorry for butting in Peter, I will go back to my cave.
Ignored
This isn't my thread, it's a 'help the newbie' thread.
As long as what you say agrees with everything I say, you're welcome anytime
 
 
  • Post #39
  • Quote
  • Sep 25, 2007 7:04pm Sep 25, 2007 7:04pm
  •  Bakuli
  • | Joined Jul 2007 | Status: Learner | 1,363 Posts
Hi Clockwork 71

Thanks for the useful advise which backs up what Peter is saying in his thread. I was foolishly trading off the 1 min charts when I first started trading a few months ago! My account was wiped out several times because of it. Now I am trying to instil the discipline in myself to stick to trading the longer timeframes and not be lured by the excitement of the shorter ones. It's an addiction that I have to shake off if I am to have any chance of survival in this challenging field.
 
 
  • Post #40
  • Quote
  • Sep 25, 2007 7:37pm Sep 25, 2007 7:37pm
  •  clockwork71
  • | Commercial Member | Joined May 2007 | 7,584 Posts
Quoting Bakuli
Disliked
Hi Clockwork 71

Thanks for the useful advise which backs up what Peter is saying in his thread. I was foolishly trading off the 1 min charts when I first started trading a few months ago! My account was wiped out several times because of it. Now I am trying to instil the discipline in myself to stick to trading the longer timeframes and not be lured by the excitement of the shorter ones. It's an addiction that I have to shake off if I am to have any chance of survival in this challenging field.
Ignored

$2,000 starting account balance
2% every week
do this for 10 years = $51 million and some change. (I think, I dont have the exact amount in front of me.)

The point is this: You can really make a hell of a living if you are shooting for reasonable returns. Maybe it takes 200 pips to get your 2%? (Because you are playing tiny lots.) That's ok, because I am willing to wait 10 years for 51 million. (Not probable, but you see the power of compounding interest in this scenario.)

Sorry - just did it on a spreadsheet, its 59 million......or 98,000 USD after taxes.

Clockwork
 
 
  • Trading Discussion
  • /
  • Help for Newbies (Discussion Thread)
  • Reply to Thread
    • 1 Page 23456 34
    • 1 Page 234 34
0 traders viewing now
  • More
Top of Page
  • Facebook
  • Twitter
About FF
  • Mission
  • Products
  • User Guide
  • Media Kit
  • Blog
  • Contact
FF Products
  • Forums
  • Trades
  • Calendar
  • News
  • Market
  • Brokers
  • Trade Explorer
FF Website
  • Homepage
  • Search
  • Members
  • Report a Bug
Follow FF
  • Facebook
  • Twitter

FF Sister Sites:

  • Metals Mine
  • Energy EXCH
  • Crypto Craft

Forex Factory® is a brand of Fair Economy, Inc.

Terms of Service / ©2023