• Home
  • Forums
  • Trades
  • News
  • Calendar
  • Market
  • Brokers
  • Login
  • Join
  • User/Email: Password:
  • 12:58pm
Menu
  • Forums
  • Trades
  • News
  • Calendar
  • Market
  • Brokers
  • Login
  • Join
  • 12:58pm
Sister Sites
  • Metals Mine
  • Energy EXCH
  • Crypto Craft

Options

Bookmark Thread

First Page First Unread Last Page Last Post

Print Thread

Similar Threads

Stop all and close all trades EA 23 replies

All Majors & Gold, Focused & Censored! 386 replies

Breakout System Most majors and TF's 3 replies

Daily Market Report For All Majors 7 replies

Majors Thread: EUR, USD, GBP, JPY 74 replies

  • Interactive Trading
  • /
  • Reply to Thread
  • Subscribe
  • 2,546
Attachments: All Majors and Gold
Exit Attachments

All Majors and Gold

  • Last Post
  •  
  • 1 201202Page 203204205 578
  • 1 Page 203 578
  •  
  • Post #4,041
  • Quote
  • Apr 10, 2013 1:27pm Apr 10, 2013 1:27pm
  •  Gbpnewbird
  • | Joined Mar 2013 | Status: Member | 27 Posts
Quoting letscry
Disliked
gona try long from 1562 if we get there
Ignored


but according to goldman, gold will drop to $1450, and $1270 end of 2014.....
 
 
  • Post #4,042
  • Quote
  • Apr 10, 2013 1:28pm Apr 10, 2013 1:28pm
  •  gnomoneey
  • Joined Mar 2012 | Status: Gold anyone | 6,647 Posts
Quoting gnomoneey
Disliked
i have sell order at 1552 tp 1470
Ignored

hopefully this trade and tp will hit this time.....

then after my long at 1581 tp 1586 for now
Wooooohooooo or Boooooohooooo
 
 
  • Post #4,043
  • Quote
  • Apr 10, 2013 1:29pm Apr 10, 2013 1:29pm
  •  gnomoneey
  • Joined Mar 2012 | Status: Gold anyone | 6,647 Posts
Quoting Gbpnewbird
Disliked
but according to goldman, gold will drop to $1450, and $1270 end of 2014.....
Ignored
i guess goldman was reading our thread last week....hahaha...in either case i have both long and short in play....
Wooooohooooo or Boooooohooooo
 
 
  • Post #4,044
  • Quote
  • Apr 10, 2013 1:44pm Apr 10, 2013 1:44pm
  •  samadum
  • | Joined Mar 2013 | Status: trader | 102 Posts
I am going to honour this bearish move and short at retracement fib zones.
 
 
  • Post #4,045
  • Quote
  • Apr 10, 2013 1:46pm Apr 10, 2013 1:46pm
  •  Fx Hiflyer
  • | Joined Oct 2012 | Status: Member | 531 Posts
Quoting gnomoneey
Disliked
i guess goldman was reading our thread last week....hahaha...in either case i have both long and short in play....
Ignored

hahah.....i was still holding my buy from 1552.....and now i am long at 69 too.....i am not in the favour of the break of 1537...i will absolutely fail if it breaks this level
 
 
  • Post #4,046
  • Quote
  • Apr 10, 2013 1:57pm Apr 10, 2013 1:57pm
  •  gnomoneey
  • Joined Mar 2012 | Status: Gold anyone | 6,647 Posts
Quoting Fx Hiflyer
Disliked
hahah.....i was still holding my buy from 1552.....and now i am long at 69 too.....i am not in the favour of the break of 1537...i will absolutely fail if it breaks this level
Ignored
goldman sachs wants this gold to drop first to low levels like 1350 -a bit extreme- but for now that's what they want imo...

it all don't matter as the banks are all going to take 50% of your deposits......hahaha on all of us....
Wooooohooooo or Boooooohooooo
 
 
  • Post #4,047
  • Quote
  • Apr 10, 2013 1:59pm Apr 10, 2013 1:59pm
  •  elekboy
  • | Joined Jan 2013 | Status: Member | 328 Posts
last week down to 1540 and then up to 1590 ($50) and down to 1555ish ($25)......its make sense for me......maybe we''ll go up to 1605 after this......
 
 
  • Post #4,048
  • Quote
  • Apr 10, 2013 2:09pm Apr 10, 2013 2:09pm
  •  gnomoneey
  • Joined Mar 2012 | Status: Gold anyone | 6,647 Posts
Quoting gnomoneey
Disliked
All targets hit. Who the man Look at my charts below First magenta tl that bounce off 1642---posted and told about for at least a couple of weeks {image} Then slow climb to 1562- which happens to be support of a range. and it's been ranging here before twice beofore and a breakout happens to the 1800 eventually after closing above 1603. If not close above 1603 with entire candle then for third time we range from 1562-1603? {image} If 1603 broken then 1625 then 1650-1680 look at this chart and pay attention to the orange ma-1579- -h4...
Ignored
go to this post from friday's post nfp
look at the bluezone .....i think i should change to 1530 to 1620.....
Wooooohooooo or Boooooohooooo
 
 
  • Post #4,049
  • Quote
  • Apr 10, 2013 2:15pm Apr 10, 2013 2:15pm
  •  Afghanistan
  • | Joined Nov 2011 | Status: Afghan FX | 53 Posts
Quoting gnomoneey
Disliked
go to this post from friday's post nfp look at the bluezone .....i think i should change to 1530 to 1620.....
Ignored
I just buy some thing like 3 lot in gold !
i think that we will see 16XX once again ! May be more then that
we have morning star in daily chart ! which work fine till now !
this is the zig zag after fifth eliot wave !
watch your sell man !
we are buyer here !
Every excuse is a choice to fail !
 
 
  • Post #4,050
  • Quote
  • Apr 10, 2013 2:21pm Apr 10, 2013 2:21pm
  •  gnomoneey
  • Joined Mar 2012 | Status: Gold anyone | 6,647 Posts
Quoting Afghanistan
Disliked
I just buy some thing like 3 lot in gold ! i think that we will see 16XX once again ! May be more then that we have morning star in daily chart ! which work fine till now ! this is the zig zag after fifth eliot wave ! watch your sell man ! we are buyer here !
Ignored
we are good my brother Afghanistan

maybe this might rattle you more or maybe not.....


http://www.forexfactory.com/news.php?do=news&id=420889


EU mulls bank law to impose losses on depositors
From reuters.com

European Union ministers will consider a proposal this week to impose losses on interbank deposits of lenders in dire financial trouble as they shape a draft EU law introducing powers that would also penalize those with big savings. Such an idea, should ministers back it, could further rattle the confidence of lenders, already nervous about draft legislation to determine who alongside shareholders should suffer losses when a bank gets into trouble. EU finance ministers, gathering in Dublin this Friday, will discuss how to shape this law that could take effect from 2015, covering what is known ... (full story)
Wooooohooooo or Boooooohooooo
 
 
  • Post #4,051
  • Quote
  • Apr 10, 2013 2:30pm Apr 10, 2013 2:30pm
  •  gnomoneey
  • Joined Mar 2012 | Status: Gold anyone | 6,647 Posts
the question is when will this manipulation stop....how far down before the blast off....

Posted April 10th, 2013 by Jim Sinclair & filed under Jim's Mailbox.

Jim

In Sprott’s latest article they made the point that for every $1 trillion rise in the central bank’s balance sheets, gold has risen by $210 and this has a 95% correlation throughout the whole bull market.

Now James Turk stated that from his work there are 155,445 tons of gold in the world and ThomsonReuters GFMS figures are about 15% higher than this so we are in the region of 178,000 tons.

Take $1 trillion and divide it by 155,445 and it equals $6,433,143 per Ton Of Gold, or $6433 per 1Kg of Gold ($200 per troy ounce)! that is awfully close to how Gold has actually been tracking the money printing as shown in Sprott’s article where they calculated $210. If you use the GFMS figures it is $230 per troy ounce.

So it seems that for every $1 trillion they add to their balance sheets Gold will go up by $200 to $230 per ounce. Obviously new mine supply has a very negligible effect as it is very small in relation to existing gold stock and also the degree of paper money balance sheet addition.

If silver maintains its roughly 50 to 1 ration then it should go up at about $4 per ounce for every $1 trillion gain in balance sheets

Hope this information helps.

Regards,
CIGA Ceri
Wooooohooooo or Boooooohooooo
 
 
  • Post #4,052
  • Quote
  • Apr 10, 2013 4:50pm Apr 10, 2013 4:50pm
  •  gnomoneey
  • Joined Mar 2012 | Status: Gold anyone | 6,647 Posts
newly report of jim sinclair and golds move today

http://kingworldnews.com/kingworldne...ld_Market.html


Sinclair also added: “This raid on gold will fail miserably, and the recovery will be even more ebullient than the decline. We may decline $25, but we will go up many hundreds of dollars from here.”
Wooooohooooo or Boooooohooooo
 
 
  • Post #4,053
  • Quote
  • Apr 10, 2013 11:59pm Apr 10, 2013 11:59pm
  •  Gbpnewbird
  • | Joined Mar 2013 | Status: Member | 27 Posts
Quoting gnomoneey
Disliked
newly report of jim sinclair and golds move today http://kingworldnews.com/kingworldne...ld_Market.html Sinclair also added: “This raid on gold will fail miserably, and the recovery will be even more ebullient than the decline. We may decline $25, but we will go up many hundreds of dollars from here.”
Ignored


http://edition.cnn.com/2013/04/10/business/cyprus-gold/
 
 
  • Post #4,054
  • Quote
  • Apr 11, 2013 1:23am Apr 11, 2013 1:23am
  •  Greenstar
  • Joined Apr 2011 | Status: Member | 1,281 Posts
I remember reading your post. I am looking at the chart trying to figure out what you saw that made you pinpoint the destination so well.

I'm looking at the daily chart, at the candle for the NFP, and today's record. What pattern did you see? If you are willing to write, thank you.

Quoting lexazver
Disliked
interestingly, gold sold off on the fed leak and then got bought and now the same happened with inventories....could it be the reversal once news is digested? although it still looks weak.. EDIT : And now it has formed a pattern that is likely to result in the price heading towards low 50s i.e. pre NFP anouncement.
Ignored
Emphasis added.
 
 
  • Post #4,055
  • Quote
  • Apr 11, 2013 1:58am Apr 11, 2013 1:58am
  •  kamifx
  • | Joined Jul 2012 | Status: Member | 477 Posts
AUDUSD
Referring to the weak Employment AUSTRALIA News, If 1.05267 holds then Sell Position and best T/P1= 1.04867
Don’t follow someone else’s trading advice blindly
 
 
  • Post #4,056
  • Quote
  • Apr 11, 2013 3:52am Apr 11, 2013 3:52am
  •  samadum
  • | Joined Mar 2013 | Status: trader | 102 Posts
Going to short at fib zones of retracement.
 
 
  • Post #4,057
  • Quote
  • Apr 11, 2013 4:45am Apr 11, 2013 4:45am
  •  lexazver
  • | Joined Dec 2006 | Status: o_O | 1,511 Posts
Quoting Greenstar
Disliked
I remember reading your post. I am looking at the chart trying to figure out what you saw that made you pinpoint the destination so well. I'm looking at the daily chart, at the candle for the NFP, and today's record. What pattern did you see? If you are willing to write, thank you. Emphasis added.
Ignored
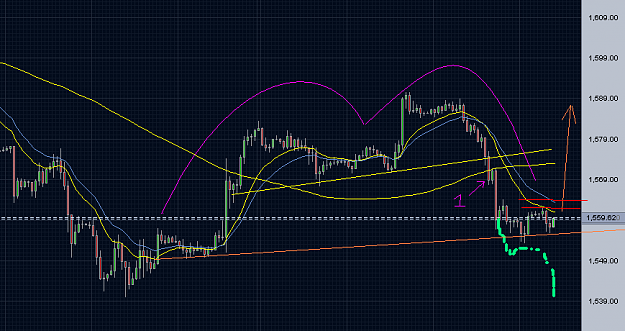
Here is the chart... Ill try my best at explaining..

In short it was a simple M- formation. Once the price broke through the yellow trend line my view skewed to the bearish side so then the price went down to something like 68 (as indicated by '1')...adn then I wrote that Unless the next hourly candle closes at 77 or above i will be extremely bearish. The price rise was capped by the 100SMA as you can see from the chart (green bar straight after long red bar marked 1). So to me it looked like the M formation would be completed and it started with NFP anouncement on Friday at around 1551 so thats why i said 'low 50s' Now that the price has reached that level I was looking for something like the light green line to look for further slide however it is currently consolidating closer to 60 than 50 hence if we can break though the 2 red lines (which marks EMA levels) then we may see the price return to mid 80s by the end of today but I feel like there will be another move down before a proper bounce. (chart is 1H by the way)
Attached Image (click to enlarge)
Click to Enlarge

Name: untitled.PNG
Size: 31 KB
 
 
  • Post #4,058
  • Quote
  • Apr 11, 2013 4:55am Apr 11, 2013 4:55am
  •  WoodyNeo
  • | Joined Nov 2012 | Status: Member | 71 Posts
Nice Chart Lexazver ! Yes I Agree With Your View We Can See A Leg Down Towards 1540-1549 Area And Than A Bounce Atleast To The 1595-1605 Area !
Quoting lexazver
Disliked
Here is the chart... Ill try my best at explaining.. In short it was a simple M- formation. Once the price broke through the yellow trend line my view skewed to the bearish side so then the price went down to something like 68 (as indicated by '1')...adn then I wrote that Unless the next hourly candle closes at 77 or above i will be extremely bearish. The price rise was capped by the 100SMA as you can see from the chart (green bar straight after long red bar marked 1). So to me it looked like the M formation would be completed and it started with...
Ignored
 
 
  • Post #4,059
  • Quote
  • Apr 11, 2013 5:16am Apr 11, 2013 5:16am
  •  lexazver
  • | Joined Dec 2006 | Status: o_O | 1,511 Posts
Quoting WoodyNeo
Disliked
Nice Chart Lexazver ! Yes I Agree With Your View We Can See A Leg Down Towards 1540-1549 Area And Than A Bounce Atleast To The 1595-1605 Area !
Ignored
I think 41-43 could be on the cards for the double bottom, but havent seen confirmation for it so far.
 
 
  • Post #4,060
  • Quote
  • Apr 11, 2013 5:34am Apr 11, 2013 5:34am
  •  lexazver
  • | Joined Dec 2006 | Status: o_O | 1,511 Posts
Quoting gnomoneey
Disliked
the question is when will this manipulation stop....how far down before the blast off.... Posted April 10th, 2013 by Jim Sinclair & filed under Jim's Mailbox. Jim In Sprott’s latest article they made the point that for every $1 trillion rise in the central bank’s balance sheets, gold has risen by $210 and this has a 95% correlation throughout the whole bull market. Now James Turk stated that from his work there are 155,445 tons of gold in the world and ThomsonReuters GFMS figures are about 15% higher than this so we are in the region...
Ignored
one comment I have about this - why didnt gold rise much higher when japan announced QE? their QE will be more than 1 trillion dollars, + given low NFP it extends FED QE for at least 1 month... i mean is that expectations of the future are reflected in today's price so why no rally?? and also from which level did they start calcultaing this 1trillion to $200 relationship i.e. given this relationship what is the price expected to be right now ?
 
 
  • Interactive Trading
  • /
  • All Majors and Gold
  • Reply to Thread
    • 1 201202Page 203204205 578
    • 1 Page 203 578
0 traders viewing now
  • More
Top of Page
Forex Factory Blog Updated: Alerting All Members
  • Facebook
  • Twitter
About FF
  • Mission
  • Products
  • User Guide
  • Media Kit
  • Blog
  • Contact
FF Products
  • Forums
  • Trades
  • Calendar
  • News
  • Market
  • Brokers
  • Trade Explorer
FF Website
  • Homepage
  • Search
  • Members
  • Report a Bug
Follow FF
  • Facebook
  • Twitter

FF Sister Sites:

  • Metals Mine
  • Energy EXCH
  • Crypto Craft

Forex Factory® is a brand of Fair Economy, Inc.

Terms of Service / ©2022