First of all this system is nothing new, nor a point and shoot Holy Grail.
Like a lot of relative newbies, I have been testing this system and that system for over a year. From morning till night 5 days a week , while studying candle patters, Fibonacci levels, and everything else that goes with it. including throwing chicken bones on the table. 3 second systems, 5m,10,15,30, H1,, H4, D1, W1, M1 and to be completely honest, I confused myself so much that I found myself LOST, feeling really down, helpless, disillusioned & disappointed in myself.
I then decided to retrace my steps with the two main indicators that I started with over a year ago, Murrey Math Lines and the De Mark indicator.
Although, I had used them separately with other indicators, I had not used them in combination with one another.
Anyway, funny when we retrace our step how things seem much clearer than they originally did.
This system not only allows me to make clearer trading decisions but also shows me PA in action o larger TF and encourages me to move up to the Daily and Weekly charts to identify the POSSIBLE breakouts being shown by the De Mark indicator and even more importantly the false breakouts.
Anyway, here are the indicators
1: Murrey Math Lines
2: Inde TD De Mark
3: Instant Trendline
4: THV3 Price (borrowed from the THV system)
5: RSI 8 RSI 13 + Stochastic Oscillator 10,3,3
6: Max Non LAG MA
7: P4 Clock
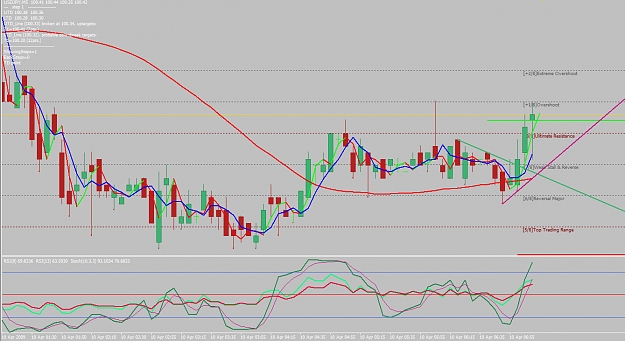
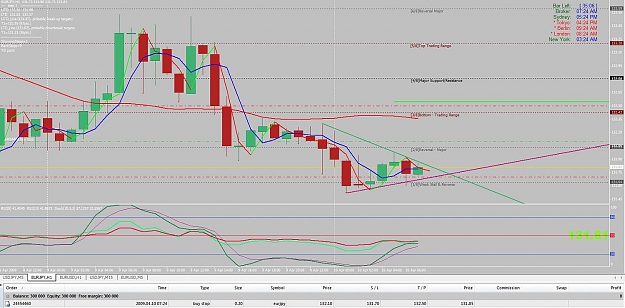
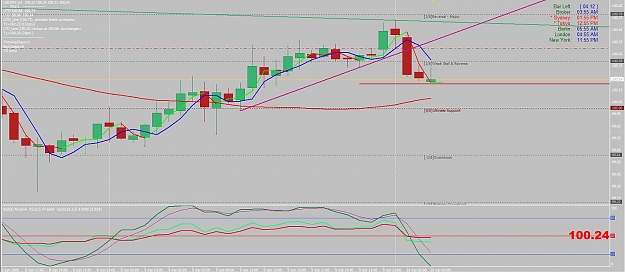
The De mark indicator will draw trend lines and alert you when a trendline has been broken. It also, informs you of a possible take profit target for both long and short trades. It also informs you ion the top left hand corner of at what price a Long and Short may occur and the amount of pips they are likeley to run before stalling or reversing.
The Murrey Math Lines show us important support and resitance levels at which Price could reverse, keeping us out of overextending our Targets or taking trades that do not have much room to run.
The Double RSI informs us of how effective the breakout is and the stochastic oscilator shows us when it is wise to exit or enter a trade.
The Max non LAG MA shows us at a glance if the trend is changing when it is green above the blue instant trendline and pointing up with good seperation from the BLUE instant trendline we know the trend is upo when it changes to red and dips to the blue line or crosses it we know the trend is going down.
I have been using this system on the 4 Hour TF with a 50SL and it did quite well, curently I am tesing it on the H1 tf to try to get the SL down a bit.
This is not a point and shoot system, you still have to do your homework to make sure a breakout is valid and has enough room to move in the direction you are trading before a reversal.
If this system can help just one person lost in the trading systems like myself it will have been worth the effort.
Also, if anyone has any ideas to improve the system, I will be glad to hear them.
DISCLAIMER: READ THIS BEFORE DOWNLOADING ANY FILES!
ONLY DEMO THIS SYSTEM. NO RESPONSOBILITY WILL BE TAKEN FOR ANYNONE USING THIS SYSTEM IN LIVE TRADING AND YOU UNDERSTAND THIS BEFORE DOWNLOADING THE INDICATORS AND TEMPLATE.
Like a lot of relative newbies, I have been testing this system and that system for over a year. From morning till night 5 days a week , while studying candle patters, Fibonacci levels, and everything else that goes with it. including throwing chicken bones on the table. 3 second systems, 5m,10,15,30, H1,, H4, D1, W1, M1 and to be completely honest, I confused myself so much that I found myself LOST, feeling really down, helpless, disillusioned & disappointed in myself.
I then decided to retrace my steps with the two main indicators that I started with over a year ago, Murrey Math Lines and the De Mark indicator.
Although, I had used them separately with other indicators, I had not used them in combination with one another.
Anyway, funny when we retrace our step how things seem much clearer than they originally did.
This system not only allows me to make clearer trading decisions but also shows me PA in action o larger TF and encourages me to move up to the Daily and Weekly charts to identify the POSSIBLE breakouts being shown by the De Mark indicator and even more importantly the false breakouts.
Anyway, here are the indicators
1: Murrey Math Lines
2: Inde TD De Mark
3: Instant Trendline
4: THV3 Price (borrowed from the THV system)
5: RSI 8 RSI 13 + Stochastic Oscillator 10,3,3
6: Max Non LAG MA
7: P4 Clock
The De mark indicator will draw trend lines and alert you when a trendline has been broken. It also, informs you of a possible take profit target for both long and short trades. It also informs you ion the top left hand corner of at what price a Long and Short may occur and the amount of pips they are likeley to run before stalling or reversing.
The Murrey Math Lines show us important support and resitance levels at which Price could reverse, keeping us out of overextending our Targets or taking trades that do not have much room to run.
The Double RSI informs us of how effective the breakout is and the stochastic oscilator shows us when it is wise to exit or enter a trade.
The Max non LAG MA shows us at a glance if the trend is changing when it is green above the blue instant trendline and pointing up with good seperation from the BLUE instant trendline we know the trend is upo when it changes to red and dips to the blue line or crosses it we know the trend is going down.
I have been using this system on the 4 Hour TF with a 50SL and it did quite well, curently I am tesing it on the H1 tf to try to get the SL down a bit.
This is not a point and shoot system, you still have to do your homework to make sure a breakout is valid and has enough room to move in the direction you are trading before a reversal.
If this system can help just one person lost in the trading systems like myself it will have been worth the effort.
Also, if anyone has any ideas to improve the system, I will be glad to hear them.
DISCLAIMER: READ THIS BEFORE DOWNLOADING ANY FILES!
ONLY DEMO THIS SYSTEM. NO RESPONSOBILITY WILL BE TAKEN FOR ANYNONE USING THIS SYSTEM IN LIVE TRADING AND YOU UNDERSTAND THIS BEFORE DOWNLOADING THE INDICATORS AND TEMPLATE.
Attached Image (click to enlarge)
Attached Image

Attached File(s)
Starting to see instead of just looking.