I wanted to share a screenshot of how order book skew can be used help predict what happened with the EURUSD today
The bar version of orderbook skew analysis is known as Volume Spread Analysis. The basic idea is that limit order book skew is a preceeds price movement. If there is lots of skew in the limit order book (i.e. bids exceeds offers substantially) and price doesn't even budge, then the demand is being satisfied by a large seller (yes through "icebergs")
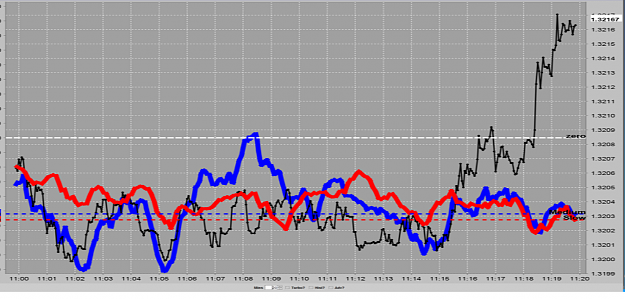
You can easily see this in the graph below of today's EURUSD actions this morning. The "blue" and "red" lines represent "realtime" (not bar which is usually unable to capture the information needed) skew of the limit order book. Blue is a "fast averge" and "red" is the "slow average" of skew.
The black line is the price.
Since both the skew averages are are below the zero line, this indicates downward skew. Significant pressure on price to "fall". Notice for almost 15 minutes, starting a little after 11:00 on the graph, sellers were selling, but price did not fall. (skew line averages are below zero and the black line that is current price really never moved from its tight range)
Instead, "sellers" selling was match by "buyers" excess demand.
Eventually, we can see that sellers were out matched and the buyers demand came through. This graph went up about 40 pips in the next 30-45 minutes. This was one of two of these moves. (the first move had very similar skewing)
In general, I see excess selling pressure translating into falling prices and excess buyers demand translating into rising prices.
Pretty neat when you can see how order book skew when properly calculated and analyzed can help predict what is likely to happen in the market. Nothing is ever certain in trading - but this does give some great insight into the cause and effect.
The bar version of orderbook skew analysis is known as Volume Spread Analysis. The basic idea is that limit order book skew is a preceeds price movement. If there is lots of skew in the limit order book (i.e. bids exceeds offers substantially) and price doesn't even budge, then the demand is being satisfied by a large seller (yes through "icebergs")
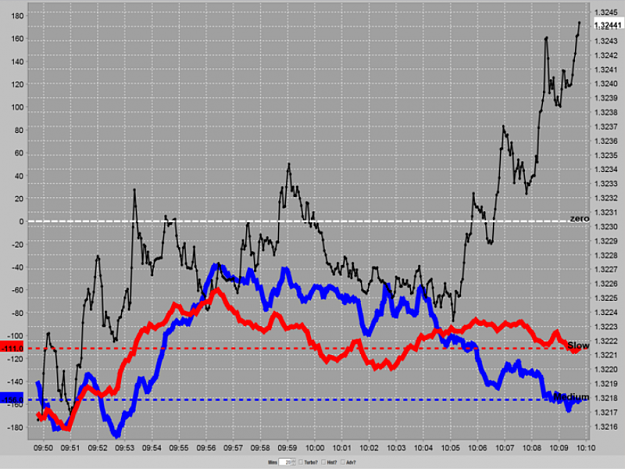
You can easily see this in the graph below of today's EURUSD actions this morning. The "blue" and "red" lines represent "realtime" (not bar which is usually unable to capture the information needed) skew of the limit order book. Blue is a "fast averge" and "red" is the "slow average" of skew.
The black line is the price.
Since both the skew averages are are below the zero line, this indicates downward skew. Significant pressure on price to "fall". Notice for almost 15 minutes, starting a little after 11:00 on the graph, sellers were selling, but price did not fall. (skew line averages are below zero and the black line that is current price really never moved from its tight range)
Instead, "sellers" selling was match by "buyers" excess demand.
Eventually, we can see that sellers were out matched and the buyers demand came through. This graph went up about 40 pips in the next 30-45 minutes. This was one of two of these moves. (the first move had very similar skewing)
In general, I see excess selling pressure translating into falling prices and excess buyers demand translating into rising prices.
Pretty neat when you can see how order book skew when properly calculated and analyzed can help predict what is likely to happen in the market. Nothing is ever certain in trading - but this does give some great insight into the cause and effect.
Attached Image (click to enlarge)