The S&P plunged already below the 200 hours line, now s/t resistance at 1278,30. While below 1281,00 on an hourly closing we expect a 1270 undershooting. Note however that the indicators are already close to the oversold area showing also potential positive reversals.
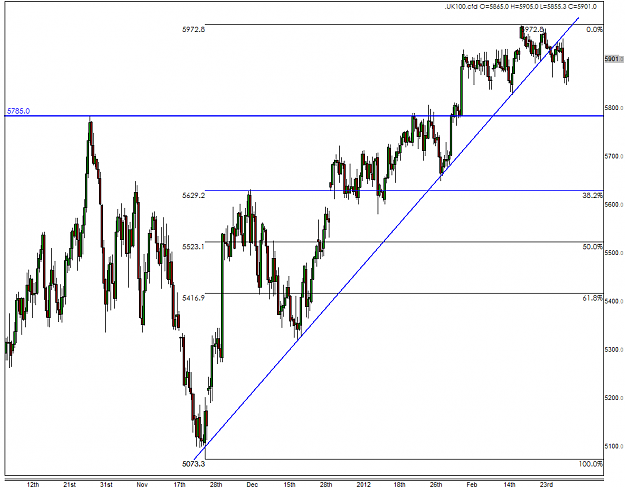
FTSE index has enjoyed a major rally in recent months but could now be in for a sizeable correction as it has broken below a long-term trend line. The key area of support is around 5785 to 5800. Traders who missed out on the rally may come in at around that range. But if the index breaks below there, and stop losses get triggered, then the selling could continue until the index retraces to 5730. The next level of support is around the 38.2% Fibonacci level of the October-February rally, at 5630. But if the FTSE can push back above 5920 and consolidate, then the bulls will then aim for 5970 with the 2011 high around 6130 back in their sights.
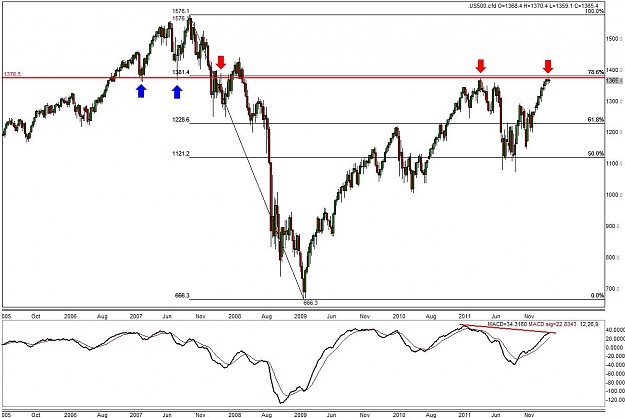
After a strong start to the year, the S&P has lost some of its upward momentum. This is hardly surprising given the extent of the rally and the fact that it is testing a significant resistance area. As you can see the index has spent the last two weeks consolidating in a 25-point range between a low of 1352.7 and a high of 1378.3. The latter area has previously provided both support and resistance to the market. While the high of the range is slightly above the May 2011 peak (1376.0), the MACD has made a lower high in this 9-month period. This is another bearish sign. More resistance levels lie ahead at 1381.4 and then 1400. The latter is a psychological level while the former marks the 78.6% Fibonacci retracement of the sell-off between October 2007 and March 2009.
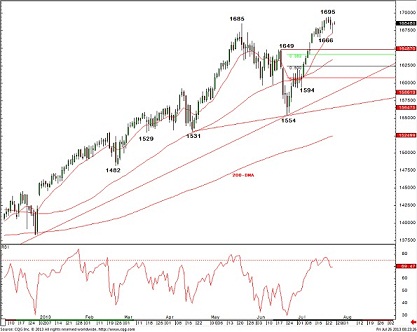
The S&P 500 is still stalled beneath the 1695 recent high, and with daily momentum turning lower, the corrective risk remains Below 1672/70 is needed to keep the immediate risk skewed to the downside for last week’s low at 1666. This though remains seen as critical, as a break below here would see a better top established. Indeed, a close below here today would see a bearish “reversal week”, which would begin to raise the prospect of a potentially larger reversal (a “double top”). Above 1688/89 is needed to reassert an upward bias for a retest of 1695/96. Beyond here can target 1702/03 next, then the 1708/16 Fibonacci/medium-term trend channel resistance cluster. The VIX has managed to hold resistance at 13.50, with a push above here needed to see the risk stay higher, for 14.56.
Holding a long stop/reverse below 1666. Square longs on strength to 1705/10 and try a short, stop above 1716. Below 1666 would see a top, for a decline to 1658, then 1648, where we would cover shorts.
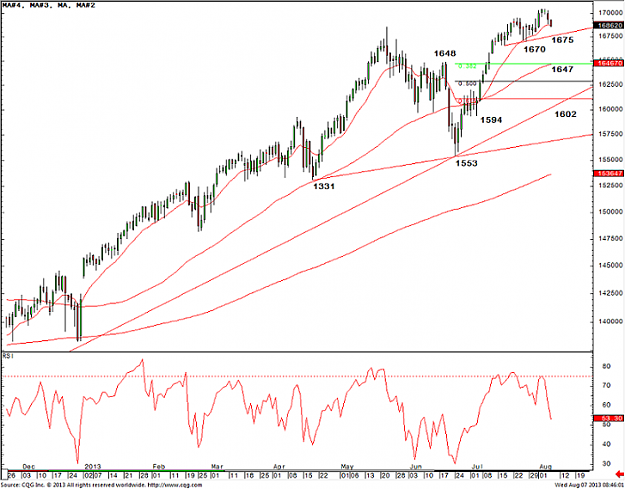
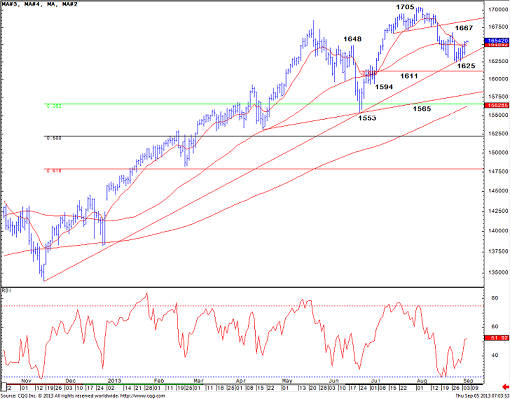
The S&P 500 has seen its expected retreat following the rally to just shy of our 1708/13 Fibonacci resistance/trend cluster target, declining back to the rising 13-day average at 1687. Although this is holding as we write, the presence of a weekly DeMark sell signal and now a downturn in momentum raises the risk we are seeing the construction of a more important top. Below 1687/85 should add weight to this view for a move to the late July low and “neckline” support at 1675/70. Below here though remains needed to see a more important top, turning the risk lower for 1649/47 initially. Above 1698 is needed to ease the immediate downside bias for a move back to 1705, ahead of tougher resistance at 1708/11. The VIX is holding above support at 11.05/00, but above 14.14/56 is needed to see a base.
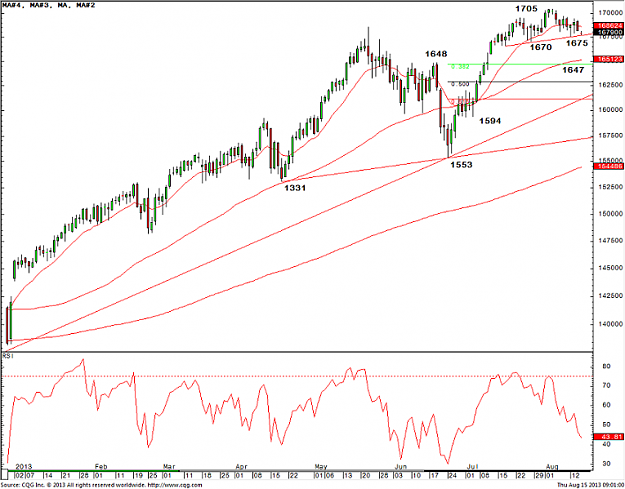
S&P 500 strength has again failed ahead of resistance at 1698, and the subsequent weakness leaves the market weighing increasingly heavily on key “neckline” and price support at 1680/70. With a bearish RSI momentum divergence and weekly DeMark sell still in place, the risk of a top remains. Only 1670 would confirm hough, turning the risk lower for 1649/47 – the 38.2% retracement of the June/August rally and rising 63-day average. We would expect fresh buyers to show here. Near-term resistance shows at 1687, then 1694. Above 1698 remains needed to ease topping fears and reassert the uptrend, for strength back to 1705, then the Fibonacci resistance cluster at 1708/11. The VIX stays in a near-term range, and only above 14.14/56 would see a base.
Holding a short S&P 500...
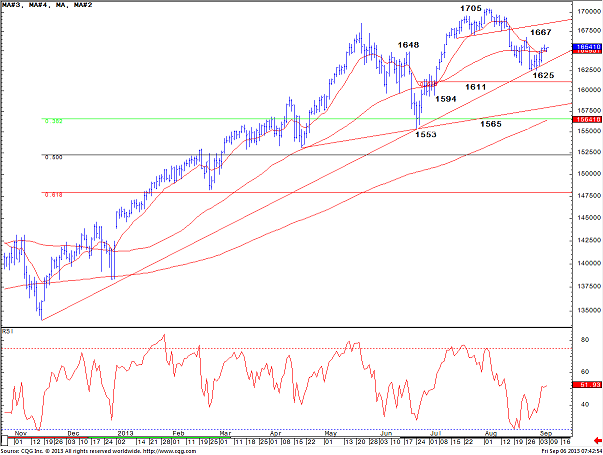
The S&P 500 has extended its defence of its recent low and uptrend from November 2012 at 1629/25, and the break above 1649/51 – the falling 13- and 63-day averages, as well as price resistance – should clear the way for further gains to 1658 next, ahead of the late August high and downtrend at 1667. While we would expect fresh sellers to show here, beyond 1667 would suggest a better base is in place for a potential resumption of the broader uptrend, targeting 1681/84 next. Support shows at 1650/49 initially, ahead of 1635, which ideally holds to keep the immediate risk higher. Below 1625 remains needed to see the uptrend break for 1620 initially, ahead of 1611 – the 61.8% retracement of the June/August rally. The VIX needs to hold above 15.00 toLook the immediate risk stay higher for 18.05/10.
Personally I have traded indicies over the last year or so with different systems without any success. Now I trade France 40 against Germany 30 and Hong Kong against Japan 225 without any indicators and actually without any charts, once a certain profit is hit, I start again.
Since the 1st August I`m up 18%, as soon as I take another trade I`ll post it here.
The S&P 500 continues its recovery off key support from its recent low and uptrend from November 2012 at 1629/25, for a test of 1658. This should be allowed to cap at first, ahead of the late August high and downtrend at 1665/67. Beyond here though remains needed to suggest a better base is in place for a potential resumption of the broader uptrend, targeting 1681/85 next. Support shows at 1650/48 initially, ahead of 1635, which ideally holds to keep the immediate risk higher. Below 1625 remains needed to see the uptrend break for 1620 initially, ahead of 1611 – the 61.8% retracement of the June/August rally.
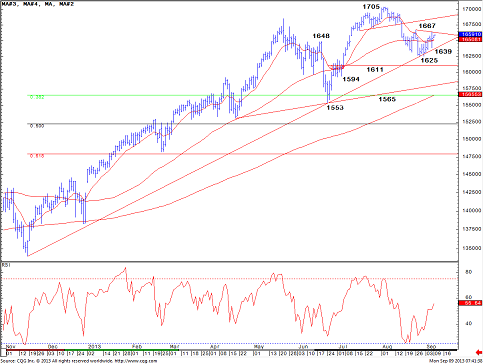
A not that unsurprising choppy session for the S&P 500 on Friday, but with weakness yet again holding its recent low and uptrend from November 2012 at 1633/25, the spotlight remains topside and on the late August high and downtrend at 1663/67. Beyond here though remains needed to suggest a better base is in place for a potential resumption of the broader uptrend, targeting 1681/85 next, the “neckline” to the July/August top. Beyond here is needed to retarget the 1705 high. Support shows at 1653 initially, ahead of 1647/46 and then 1639/33, which ideally holds to keep the immediate risk higher. Below 1625 remains needed to see the uptrend break. The VIX above 15.00 can see the immediate risk stay higher for 18.05/10. Holding a long still, stop/reverse below 1625. Reverse longs back to a short at 1663/65, stop/reverse above 1667, as a break can target 1681/85 initially.
Below 1625 should see weakness extend to 1612/10, where I would cover shorts.
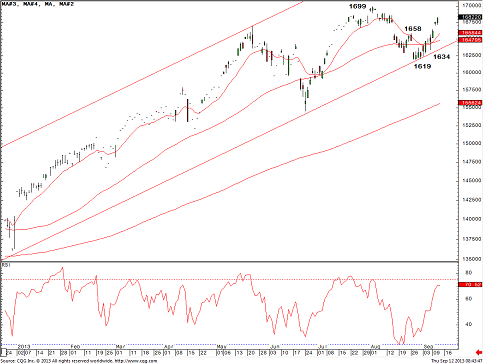
We turn our attention to the December contract. The S&P 500 continues to push higher, and the front month continuation series has broken above the “neckline” to the July/August top. Near-term momentum has eased a touch, warning of a setback to 1672/68, and potentially 1664. However, we look for this latter level to then ideally hold for strength back to 1686/87, ahead of 1692/94 and then the 1699 contract high, ahead of the 1705 continuation high. Below 1664 would warn of a deeper setback to 1653/52. The VIX has broken support at 14/13.90, and we Trading Look for the decline to extend to 13.10. Rolling the long. Add on weakness to 1664/60, stop below 1658. Take profit at 1705/10.
Below 1658 should see a deeper setback to 1652/50. Retry a long here, stop below 1645.