There are many definitions for Bulls and Bears traps but I am only interested in traps in the context of this collections. In simple words, a trap will appear when traders, especially weak players (in intraday common timeframes), are caught in the weak side of the current direction.
Any trap involves 3 stages. In the case of a bear trap:
- The move is first propelled by late buyers, especially in a swing high or a test of a resistance level, stuck without profits by consecutive bear bars. They will be forced to close positions or their stops will be easily hit.
- The second force in the trap is the sellers calling the top or reversal.
- The trap is completed when the sellers of the apparent top/reversal break the lows of 1 or more bull bars forcing some late buyers (all or almost all weak or short term buyers) to close their position and giving a new cheap price for smart buyers to go long and continue the move up.
Introducing bars 7 and 8 in the example (fig 8a), shows these stages very clearly. All late buyers on the highs of the 4th bar are under water after the close of the 6th bar (they are losing money in every tick down). New sellers calling the top/reversal appear until the break of the low of Bar 7 that kills all buyers of the 4th bar.
Finally, late sellers (weak and amateurs) are attracted to go short on the apparent confirmed reversal but they get trap when the real buyers (those in point of control A1) fund a new bargain to buy and move the prices up.
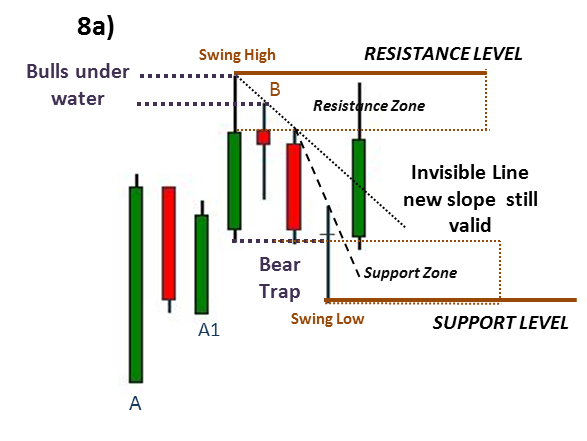
-> As you can see enough bears were trapped making the start of the new wave up (bar 8) fast and furious (weak sellers covering in the rush). The break of the resistance level will only happen if enough buyers get in. The easy entry without indicators or volume analysis is at the close of bar 7 (No indicator will give you such a fast signal and it happens many times every single day)
Of course by the close of the 8th bar there is a new swing low, a new support level and a new support zone. This mark the start of the new wave, the one we were waiting for the high probability setup to go long. Extra confirmation is given by the break of the invisible line connecting the Highs of bar 6 and 7. In this particular case this entry (the open of the 8th bar) is exactly the same as the one in the bear trap.
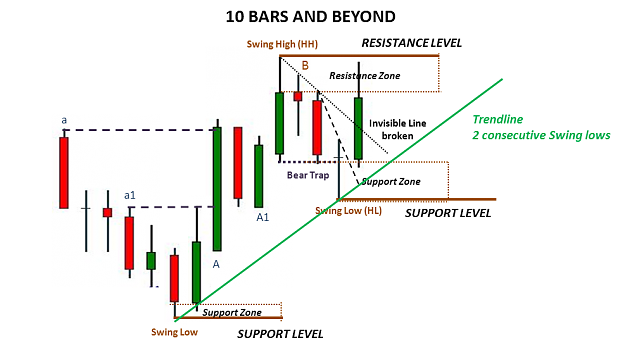
In the second example 8b), bar 7, forms a first swing low, a support level and a support zone. In this case there is also a potential bull trap forming when the late sellers on the 6th bar are under water after the close of the 7thbar (they are losing money in every tick up). New buyers calling the bottom/reversal appear in Bar 7 that kills all sellers of the previous bars but find resistance on the expected point of control a1.

However, in contrast with the previous case the buyers on the 8th bar are real and strong and they manage to kill all sellers breaking both point of controls (a1 and a) and clearly signaling the break and change of direction to the long side.
If you pay attention to detail the last bar in this chart is the first on the first case and that's when this collection ends: connecting the last 2 consecutive swing lows with a trendline and waiting for a new swing low for longs.
...and that conclude the series .... i hope some find some clues, hints or simple reminders of basic concepts ...
sisse