• Home
  • Forums
  • Trades
  • News
  • Calendar
  • Market
  • Brokers
  • Login
  • Join
  • User/Email: Password:
  • 3:29am
Menu
  • Forums
  • Trades
  • News
  • Calendar
  • Market
  • Brokers
  • Login
  • Join
  • 3:29am
Sister Sites
  • Metals Mine
  • Energy EXCH
  • Crypto Craft

Options

Bookmark Thread

First Page First Unread Last Page Last Post

Print Thread

Similar Threads

NASDAQ - Price Action & ICT 149 replies

ES S&P 500 futures, NQ NASDAQ 100 futures, RTY Russell 2000 3 replies

DAX & Nasdaq cash open daily profits 1 reply

ECN && STP && Scalping && Hedging - Broker Review - Oct 2009 24 replies

Why trade in USD on NYSE & NASDAQ if USD is going to be worthless soon? 7 replies

  • Trading Journals
  • /
  • Reply to Thread
  • Subscribe
  • 366
Attachments: NYSE & Nasdaq
Exit Attachments

NYSE & Nasdaq

  • Last Post
  •  
  • Page 1 23456 28
  • Page 1 234 28
  •  
  • Post #1
  • Quote
  • First Post: Edited Sep 2, 2012 12:12am Aug 18, 2011 5:50pm | Edited Sep 2, 2012 12:12am
  •  split_unit
  • | Joined Jul 2008 | Status: Member | 709 Posts
I am starting this thread on the NYSE & NASDAQ equities markets. I trade/invest in both using fundamental, technical and quantitative analysis and thought that it would be a great idea to start a thread where interesting ideas are posted. I will personally post when ever I get the time. I also hope that as the thread grows, meaningful discussions take place for the benefit of all readers.

Discussing theories with other people, especially if you have to explain them first, is extremely useful in helping you develop your own understanding. Trying to teach somebody else what you know is a great way of finding out exactly what you know, and what you don’t!

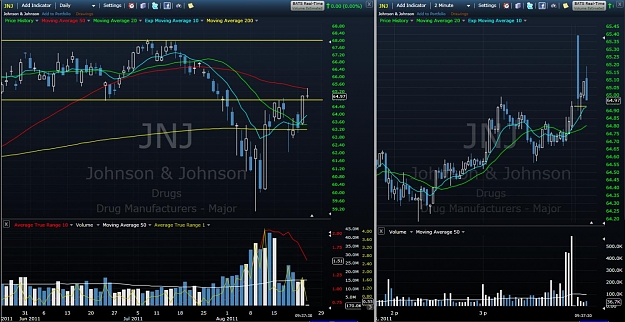
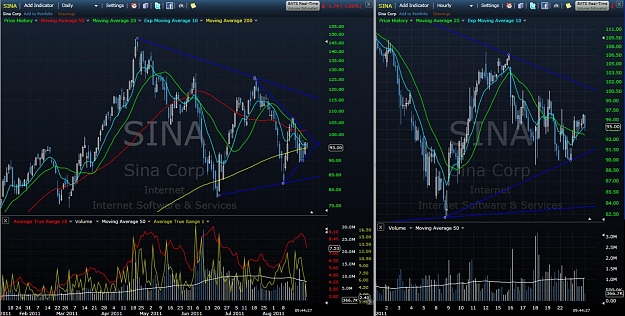
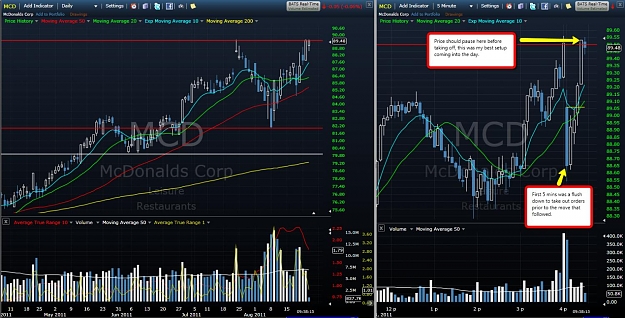
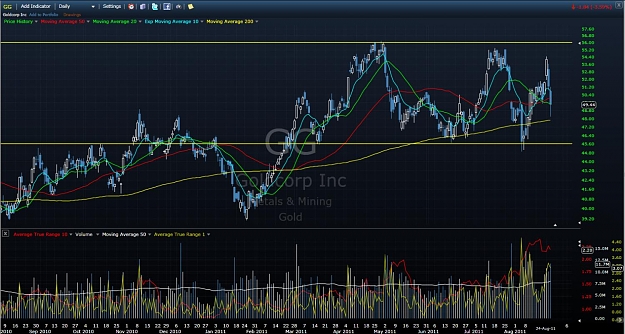
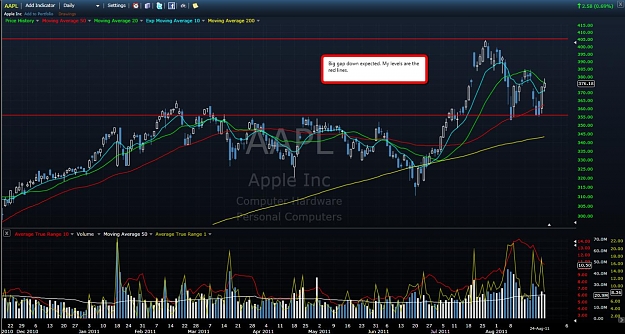
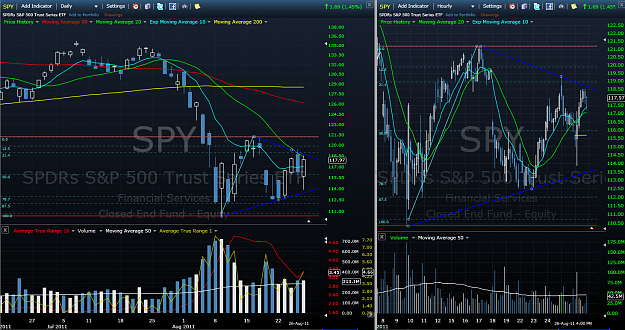
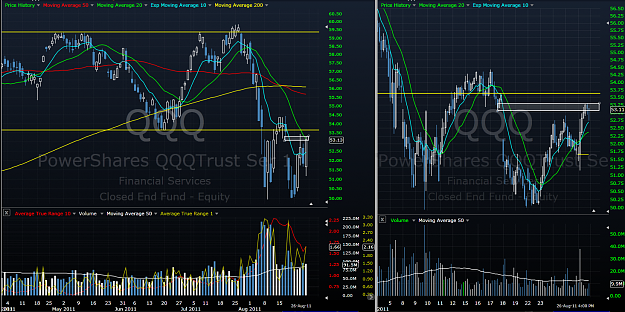
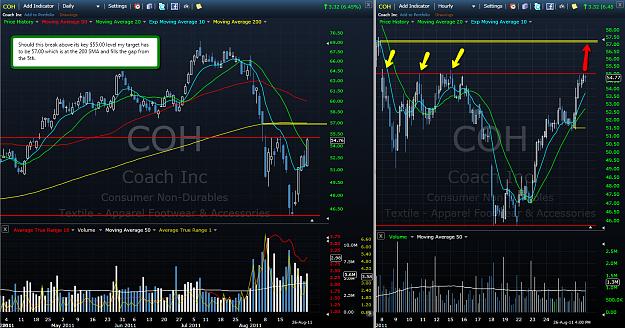
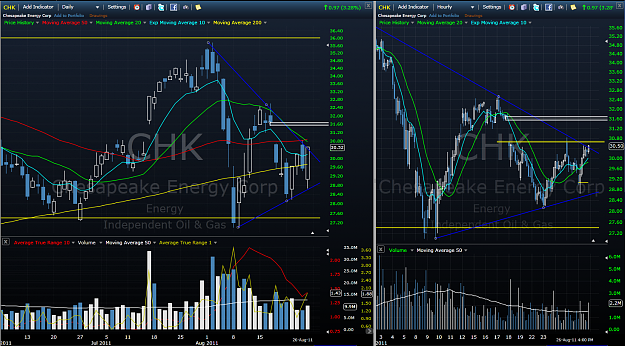
P.S. I use www.freestockcharts.com for my charts displayed.
Attached Image (click to enlarge)
Click to Enlarge

Name: 2011-08-19_0143_DOW.jpg
Size: 151 KB
  • Post #2
  • Quote
  • Aug 18, 2011 6:07pm Aug 18, 2011 6:07pm
  •  split_unit
  • | Joined Jul 2008 | Status: Member | 709 Posts
S&P 500
Attached Image (click to enlarge)
Click to Enlarge

Name: 2011-08-19_0158_SP_500.jpg
Size: 148 KB
 
 
  • Post #3
  • Quote
  • Aug 18, 2011 6:17pm Aug 18, 2011 6:17pm
  •  split_unit
  • | Joined Jul 2008 | Status: Member | 709 Posts
This is FINVIZ heatmap, I use this to assess the market. It is especially helpful in identifying sentiment along with sectors in play.
Attached Image (click to enlarge)
Click to Enlarge

Name: 2011-08-19_0212_S&P_500_MAP.png
Size: 489 KB
 
 
  • Post #4
  • Quote
  • Aug 20, 2011 1:23pm Aug 20, 2011 1:23pm
  •  split_unit
  • | Joined Jul 2008 | Status: Member | 709 Posts
Breakdown at a round number...classic setup in Starbucks
Attached Image (click to enlarge)
Click to Enlarge

Name: 2011-08-20_2120_SBUX_Breakdown.png
Size: 276 KB
 
 
  • Post #5
  • Quote
  • Aug 20, 2011 1:28pm Aug 20, 2011 1:28pm
  •  split_unit
  • | Joined Jul 2008 | Status: Member | 709 Posts
Another one of my setups for Monday, EBAY < 27.00
Attached Image (click to enlarge)
Click to Enlarge

Name: 2011-08-20_2126_EBAY_Breakdown.png
Size: 288 KB
 
 
  • Post #6
  • Quote
  • Aug 23, 2011 12:42pm Aug 23, 2011 12:42pm
  •  split_unit
  • | Joined Jul 2008 | Status: Member | 709 Posts
NVDA trade
Attached Image (click to enlarge)
Click to Enlarge

Name: 2011-08-23_2028_NVDA.jpg
Size: 163 KB
 
 
  • Post #7
  • Quote
  • Aug 23, 2011 12:58pm Aug 23, 2011 12:58pm
  •  split_unit
  • | Joined Jul 2008 | Status: Member | 709 Posts
JNJ possible breakout
Attached Image (click to enlarge)
Click to Enlarge

Name: 2011-08-23_2053_jnj.jpg
Size: 170 KB
 
 
  • Post #8
  • Quote
  • Aug 23, 2011 1:14pm Aug 23, 2011 1:14pm
  •  split_unit
  • | Joined Jul 2008 | Status: Member | 709 Posts
EBAY insideday breakout.
Attached Image (click to enlarge)
Click to Enlarge

Name: 2011-08-23_2108_NVDA.jpg
Size: 158 KB
 
 
  • Post #9
  • Quote
  • Aug 24, 2011 4:57am Aug 24, 2011 4:57am
  •  split_unit
  • | Joined Jul 2008 | Status: Member | 709 Posts
Longs: GG

Breakouts: ALTR>37.65, AET>38.50, ZOM>74.75, AXP>46.50, KO>69.75, COST>77.50, MCD>89.50, BBY>23.50, DPS>36.50 (HBO), TRV<48.50, WAG<34.00

Shorts: JNJ, COH, ALTR, WFC, JPM

Notes:

MCD about to make new 52 week highs.

SPY key level to watch is 116.50

GLD the gold ETF got hit on ultra high volume to the downside.

EUR/USD still choppy, possibly forming a cup and handle pattern with 1.4500 being the key level.
 
 
  • Post #10
  • Quote
  • Aug 24, 2011 9:40am Aug 24, 2011 9:40am
  •  split_unit
  • | Joined Jul 2008 | Status: Member | 709 Posts
JNJ short.
Attached Image (click to enlarge)
Click to Enlarge

Name: 2011-08-24_1737_JNJ_short.jpg
Size: 152 KB
 
 
  • Post #11
  • Quote
  • Aug 24, 2011 9:47am Aug 24, 2011 9:47am
  •  split_unit
  • | Joined Jul 2008 | Status: Member | 709 Posts
Consolidation in SINA
Attached Image (click to enlarge)
Click to Enlarge

Name: 2011-08-24_1744_SINA_Contraction.jpg
Size: 167 KB
 
 
  • Post #12
  • Quote
  • Aug 24, 2011 10:01am Aug 24, 2011 10:01am
  •  split_unit
  • | Joined Jul 2008 | Status: Member | 709 Posts
MCD Long
Attached Image (click to enlarge)
Click to Enlarge

Name: 2011-08-24_1758_MCD.jpg
Size: 169 KB
 
 
  • Post #13
  • Quote
  • Aug 25, 2011 7:49am Aug 25, 2011 7:49am
  •  split_unit
  • | Joined Jul 2008 | Status: Member | 709 Posts
GG long, the lower this opens today the more interested I will be. I want to see it push lower prior to me buying.
Attached Image (click to enlarge)
Click to Enlarge

Name: 2011-08-25_1548_GG.jpg
Size: 166 KB
 
 
  • Post #14
  • Quote
  • Aug 25, 2011 7:57am Aug 25, 2011 7:57am
  •  split_unit
  • | Joined Jul 2008 | Status: Member | 709 Posts
It will be very interesting to see how the market incorporates the news of the departure of S. Jobs. As evident from the chart, the QQQ (NASDAQ ETF) has broken down and since its highly dependant on the technology sector, a move in a market leading stock like AAPL could be critical to determining the upcoming move.
Attached Images (click to enlarge)
Click to Enlarge

Name: 2011-08-25_1554_AAPL.jpg
Size: 153 KB Click to Enlarge

Name: 2011-08-25_1553_QQQ.jpg
Size: 173 KB
 
 
  • Post #15
  • Quote
  • Edited at 9:52am Aug 25, 2011 8:12am | Edited at 9:52am
  •  split_unit
  • | Joined Jul 2008 | Status: Member | 709 Posts
Longs: GG

Breakouts: UNH >46.00, AET>38.50, COST>77.50, KO>69.80, TRV<48.50, XOM>74.50

Shorts: C, ETN , AXP , BBY, CHK, SBUX, DD

Notes:

CocaCola
TRV Could breakdown due to weather news.
EUR/USD key level at 1.4500 - 1.4350, 3 inside days.
Jackson Hole Symposium
AAPL Steve Jobs Resignation
 
 
  • Post #16
  • Quote
  • Aug 25, 2011 2:44pm Aug 25, 2011 2:44pm
  •  split_unit
  • | Joined Jul 2008 | Status: Member | 709 Posts
Here is an example of a textbook breakdown, the insurance idustry is weak today due to weather concerns in the US. This trade played out nicely, however, it isn't always this clean.
Attached Image (click to enlarge)
Click to Enlarge

Name: 2011-08-25_2239_TRV.png
Size: 263 KB
 
 
  • Post #17
  • Quote
  • Aug 25, 2011 2:47pm Aug 25, 2011 2:47pm
  •  split_unit
  • | Joined Jul 2008 | Status: Member | 709 Posts
Quoting split_unit
Disliked
GG long, the lower this opens today the more interested I will be. I want to see it push lower prior to me buying.
Ignored
Goldcorp (GG) my only long idea coming into the day also played out perfectly. Again, things arean't always this clean.
Attached Image (click to enlarge)
Click to Enlarge

Name: 2011-08-25_2245_GG_Saturation.png
Size: 261 KB
 
 
  • Post #18
  • Quote
  • Aug 28, 2011 12:48pm Aug 28, 2011 12:48pm
  •  split_unit
  • | Joined Jul 2008 | Status: Member | 709 Posts
Here are two charts of the SPY (S&P 500 ETF) and the QQQ (NASDAQ ETF), both are at decisive levels. The SPY is wedging here and the QQQ's just filled the gap from the 17th of August. Will be an interesting week.
Attached Images (click to enlarge)
Click to Enlarge

Name: 2011-08-28_2043_SPY_.png
Size: 268 KB Click to Enlarge

Name: 2011-08-28_2046_QQQ.png
Size: 260 KB
 
 
  • Post #19
  • Quote
  • Aug 28, 2011 1:03pm Aug 28, 2011 1:03pm
  •  split_unit
  • | Joined Jul 2008 | Status: Member | 709 Posts
COH breakout imminent, after 4 touches it should breakout, my target is the gapfill from August 5th and the 200 SMA at 57.
Attached Image (click to enlarge)
Click to Enlarge

Name: 2011-08-28_2052_COH.png
Size: 260 KB
 
 
  • Post #20
  • Quote
  • Aug 28, 2011 3:47pm Aug 28, 2011 3:47pm
  •  split_unit
  • | Joined Jul 2008 | Status: Member | 709 Posts
CHK an oil and gas company that hightly correlates with XOP ETF has provided us with an excellent setup, a breakout thats also a gap fill.
Attached Image (click to enlarge)
Click to Enlarge

Name: 2011-08-28_2336_CHK.png
Size: 268 KB
 
 
  • Trading Journals
  • /
  • NYSE & Nasdaq
  • Reply to Thread
    • Page 1 23456 28
    • Page 1 234 28
0 traders viewing now
  • More
Top of Page
  • Facebook
  • Twitter
About FF
  • Mission
  • Products
  • User Guide
  • Media Kit
  • Blog
  • Contact
FF Products
  • Forums
  • Trades
  • Calendar
  • News
  • Market
  • Brokers
  • Trade Explorer
FF Website
  • Homepage
  • Search
  • Members
  • Report a Bug
Follow FF
  • Facebook
  • Twitter

FF Sister Sites:

  • Metals Mine
  • Energy EXCH
  • Crypto Craft

Forex Factory® is a brand of Fair Economy, Inc.

Terms of Service / ©2022