Before going into the subject, let me explain how I understand and build the Gann box and angles using MT4 tools. As to what the standard MT4 Gann Fan does - honestly, I don't know. To me, it is just useless, especially when I compare it with the way I was taught to draw it. The example is EU, 30 min, April 25-26-27 and on so you can check it yourself.
First, we identify an important peak and valley. Then, I use the Fibo extention tool with parameters - 0, 0.25, 0.5, 0.75 and 1:
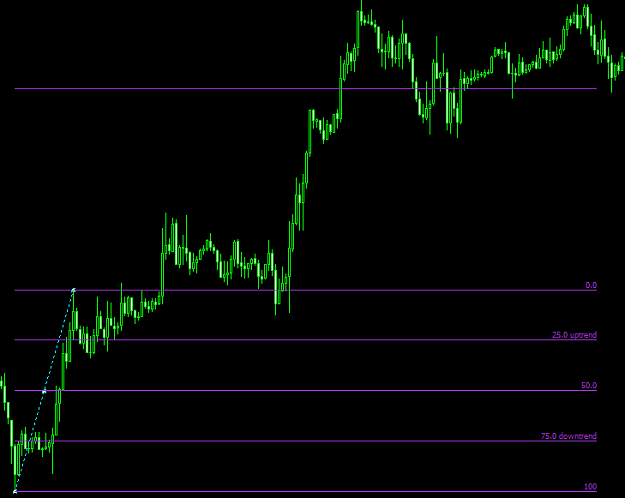
After that I use the Fibonacci Timezones tools with parameters 0, 1, 2, 3, 4. The idea is, the first swing is normally too small and sharp to draw sensible angles from, so we multiply the initial section by 4 right away to see a longer-term perspective:
Now we got all those nice boxes to draw trendlines on. Some of the main ones:
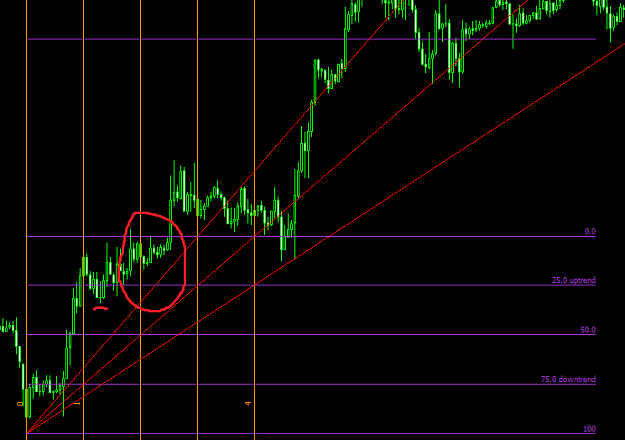
Notice, that we could do this already somewhere where I drew the red circle, because we could identify the first low by then (underlined on the pic).
The difficulty, especially when you just have one, the very first swing, is to figure out, which of those lines (and you can draw quite a dozen there) are important. This is a voluntary decision to make. Normally, after you have more candles on chart developed, it becomes pretty clear, which angles the present trend "prefers".
Now, if you apply the standard Gann Fan... in most cases we'll find something much less attractive than this. I am not saying, the Gann Fan is "wrong" in MT, maybe I don't understand something... then you tell me.
Now, probably there is an easier way (a second method) to draw those trendlines in MT4 - to use Fibo Fan with parameters like 0.25, 0.5, 0.75, 1, -0.25, -0.5, -0.75, -1 etc. I have tried this a few times and sometimes had a perfect fit with the boxes drawn with the first method... But I am not 100% sure yet. In the picture below, though, I use the Fibo Fan as it does match.
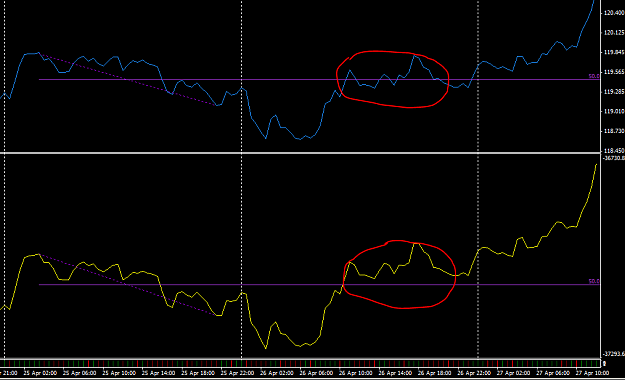
OK, so much for Gann. Now, I discovered a wonderful indicator - Wilder's ASI (Accumulative Swing Index). For the explanation you can read about it in his book "New concepts...". To get the indie, just google "ASI codebase". It basically gives an alternative price chart, that is a bit different from the price chart - and those differences are quite important. If the two confirm each other, it is a much stringer signal. OK, now the picture of price and ASI with Gann angles (or what I call Gann angles) applied:
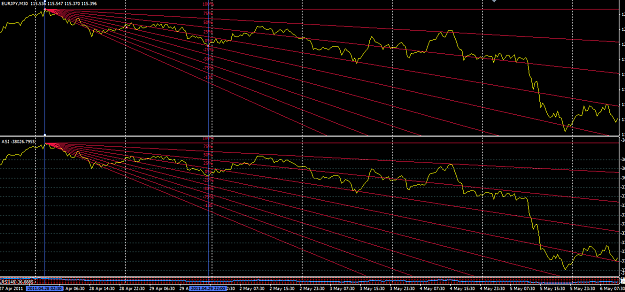
Compare, for example, the recent flat on May 5, just before the sharp fall - the price stays above the trendline and is horizontal, but the ASI holds clearly below, and, though very slightly, is inclined down. I'd definitely stayed away from longs that day.
As you can see, I have used the second low here (or maybe third, but the 1st and 2nd are the same angle so can be considered one) as the base for the Gann box. In my experience, the boxes are more reliable for determining long-term trends if they are built on the basis of the second swing, and, even better, belonging to the next day. But again, this is no exact science - you begin to see that the price goes away from you initial setup and ignores it, just start looking for the one that seems to fit better.
Right, the post is too long. Basically, I am not suggesting anything, just throwing ideas, who knows, maybe someone uses something similar and can give a different view of it. I am really interested in initiation of trades based on ASI, than Gann lines... Wilder gives some advice on that in his book... but all is good, any comments welcome.
Cheers for now.
PS Can't get rid of the pic at the bottom ;(
First, we identify an important peak and valley. Then, I use the Fibo extention tool with parameters - 0, 0.25, 0.5, 0.75 and 1:
Attached Image (click to enlarge)
After that I use the Fibonacci Timezones tools with parameters 0, 1, 2, 3, 4. The idea is, the first swing is normally too small and sharp to draw sensible angles from, so we multiply the initial section by 4 right away to see a longer-term perspective:
Now we got all those nice boxes to draw trendlines on. Some of the main ones:
Attached Image (click to enlarge)
Notice, that we could do this already somewhere where I drew the red circle, because we could identify the first low by then (underlined on the pic).
The difficulty, especially when you just have one, the very first swing, is to figure out, which of those lines (and you can draw quite a dozen there) are important. This is a voluntary decision to make. Normally, after you have more candles on chart developed, it becomes pretty clear, which angles the present trend "prefers".
Now, if you apply the standard Gann Fan... in most cases we'll find something much less attractive than this. I am not saying, the Gann Fan is "wrong" in MT, maybe I don't understand something... then you tell me.
Now, probably there is an easier way (a second method) to draw those trendlines in MT4 - to use Fibo Fan with parameters like 0.25, 0.5, 0.75, 1, -0.25, -0.5, -0.75, -1 etc. I have tried this a few times and sometimes had a perfect fit with the boxes drawn with the first method... But I am not 100% sure yet. In the picture below, though, I use the Fibo Fan as it does match.
OK, so much for Gann. Now, I discovered a wonderful indicator - Wilder's ASI (Accumulative Swing Index). For the explanation you can read about it in his book "New concepts...". To get the indie, just google "ASI codebase". It basically gives an alternative price chart, that is a bit different from the price chart - and those differences are quite important. If the two confirm each other, it is a much stringer signal. OK, now the picture of price and ASI with Gann angles (or what I call Gann angles) applied:
Attached Image (click to enlarge)
Compare, for example, the recent flat on May 5, just before the sharp fall - the price stays above the trendline and is horizontal, but the ASI holds clearly below, and, though very slightly, is inclined down. I'd definitely stayed away from longs that day.
As you can see, I have used the second low here (or maybe third, but the 1st and 2nd are the same angle so can be considered one) as the base for the Gann box. In my experience, the boxes are more reliable for determining long-term trends if they are built on the basis of the second swing, and, even better, belonging to the next day. But again, this is no exact science - you begin to see that the price goes away from you initial setup and ignores it, just start looking for the one that seems to fit better.
Right, the post is too long. Basically, I am not suggesting anything, just throwing ideas, who knows, maybe someone uses something similar and can give a different view of it. I am really interested in initiation of trades based on ASI, than Gann lines... Wilder gives some advice on that in his book... but all is good, any comments welcome.
Cheers for now.
PS Can't get rid of the pic at the bottom ;(
Attached Image (click to enlarge)