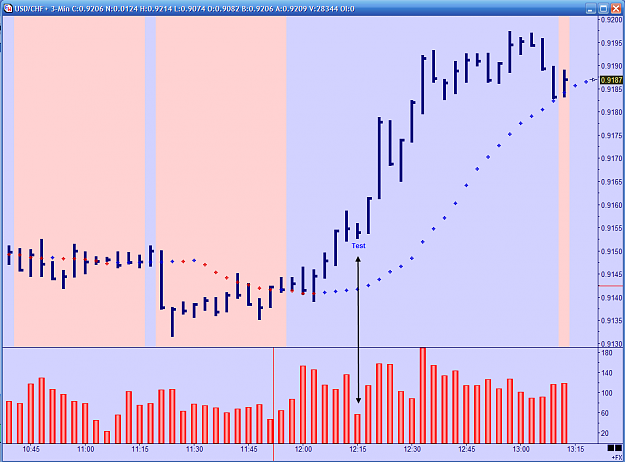
DislikedAlso on a 15 min chart wouldn't we consider the bar at 12pm est a no demand bar? and isn't it still valid because the UT closed lower than the close of the no demand bar.
That brings me to a question, on tests such as no demands if the next bar makes a higher high, but closes lower than the close of the no demand do we still consider it valid? I know there are a lot of what ifs, but i've been seeing these a little more, just curious. Kinda like the one we are talking about.Ignored
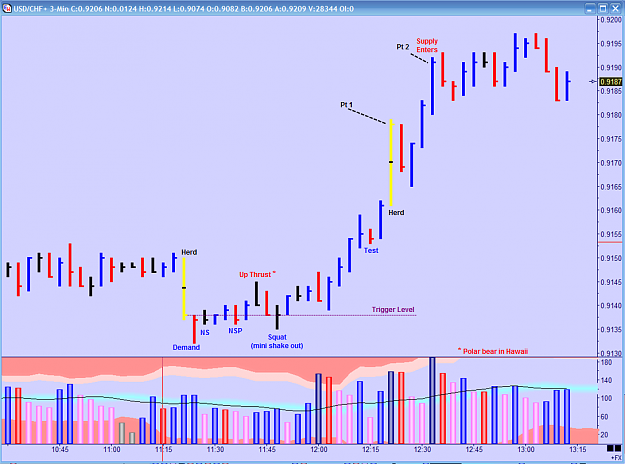
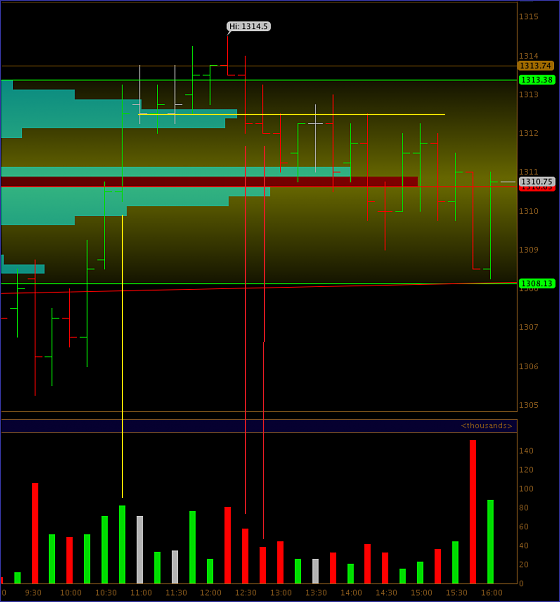
Yellow lines are trigger bar and trigger level.
Red lines are KRB closing below trigger and a test of the trigger level. Safe entry on break of this test bars low.
Attached Image
Today's zone = Tomorrow's opportunity!