DislikedHi Jason
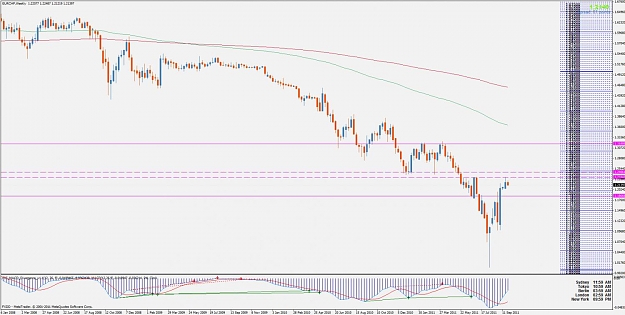
Many thanks indeed for the response. Yes, the charts were created at different times, but I wouldn't expect that to make the EMAs move. I mean, once it's printed it should stay there. History can't, or at least shouldn't, change. And on the weeklies this is data that goes back a very long time. Your thoughts?Ignored
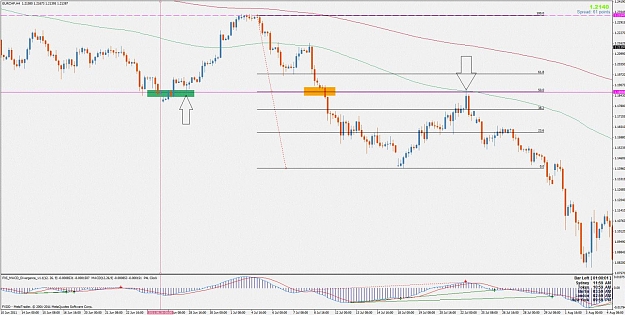
It isn't that the EMA is moving as Jason was saying(thanks for hoping in Jason). It's that the EMA which is calculated based on the data that your broker has. So your EMA is based on the closing times of your brokers data. Since forex is an OTC non centralized market brokers can show different start/closing times which can change the look of EMAs from broker to broker. So your EMA is correct(since its a mathematical formula) based on your broker closing time. Jarroo is based on his. On weekly charts the close times will be very close so they won't be shifted too much. But if you check out for example a 4hr chart from two different closing time brokers you could see a much large discrepancy. A timeframe like the one hour will always be the same because the start and close time of the one hour candle is universal. Same for a 5min, or 15, 30
Hope that helps
Mike