Your bar is just barely a beob with the lower low then the previous bar....
Ignored
Thanks Mike. As always your simplicity is unparalleled. PA has really changed my trading positively...hopefully in time, I'll be able to analyze the markets like you guys.
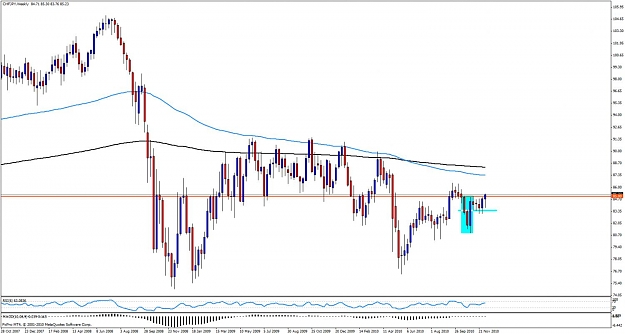
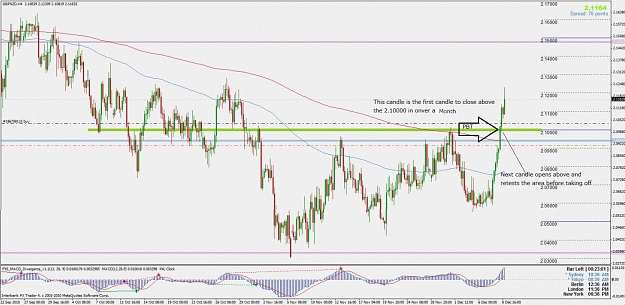
Yes, it was...I watched the H4 candle close above the BRN, the first candle to do so in over a month. The next candle open was above the RN, it tested the area and took off.
EDIT:
That Was the first candle to close above that area in over a month not a year.
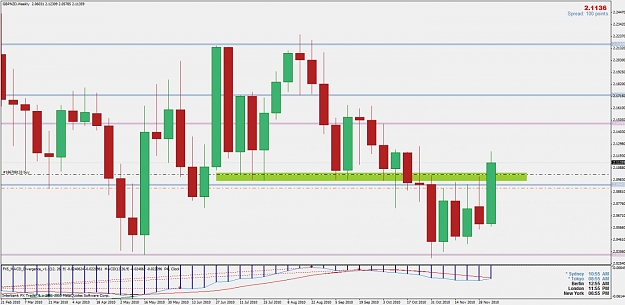
Took this today. Not the best pin, but for me it had good location and confluence; at a swing high off a trendline and it had double fib confluence also.
Two confirmed LH's showed there was momentum behind the move, even though the dominant trend is up. Showed nice rejection of price after a strong bull bar.
The only reasons i came up with to not take the trade was that the FTA was quite close and it went a against the dominant trend.
Am i on the right track with my analysis?
Price was 5 pips away from my 3rd target area, got out with +35 pips at full value. This time i didnt take partial profit, but chose to move my stop once each target area was reached.
Yes, it was...I watched the H4 candle close above the BRN, the first candle to do so in over a year. The next candle open was above the RN, it tested the area and took off.
Ignored
I like to see a close above previous Resistance occurr on a higher time frame but this also works . .nice job.
Why not move to break even or are you looking for a more long term play here?
Indicators show the past. Price Action "Indicates" the future.
I like to see a close above previous Resistance occurr on a higher time frame but this also works . .nice job.
Why not move to break even or are you looking for a more long term play here?
Ignored
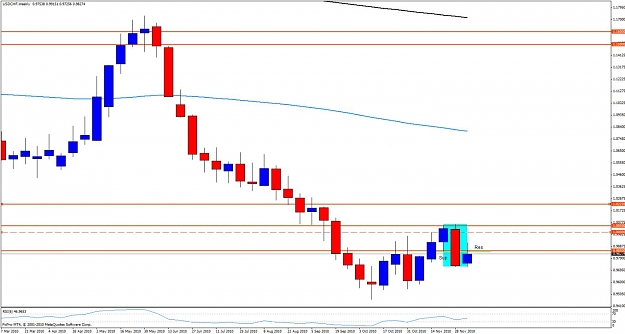
Well, this H4 breakout got me into the Monthly PB break and looking at the weekly TF, we have a nice flip area that the daily candle may well close above in the next 4 mins. I want to give it a little more room than BE.
EDIT: Sorry. Still half asleep here....I actually traded 0.05 and took off 0.03 and moved the SL to less than the profit taken so, I am actually at BE already without moving the SL to the point of entry. If you see what I mean.
Took this today. Not the best pin, but for me it had good location and confluence; at a swing high off a trendline and it had double fib confluence also.
Two confirmed LH's showed there was momentum behind the move, even though the dominant trend is up. Showed nice rejection of price after a strong bull bar.
The only reasons i came up with to not take the trade was that the FTA was quite close and it went a against the dominant trend.
Am i on the right track with my analysis?
Price was 5 pips away from my 3rd target area, got out with +35...
Ignored
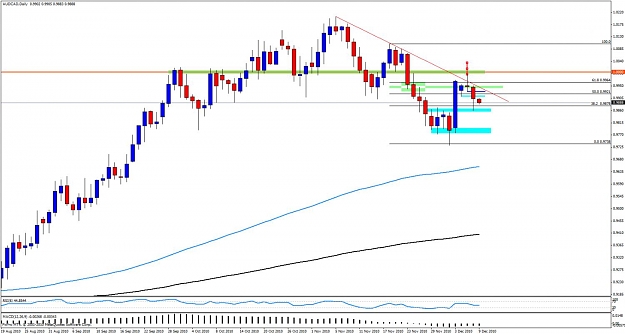
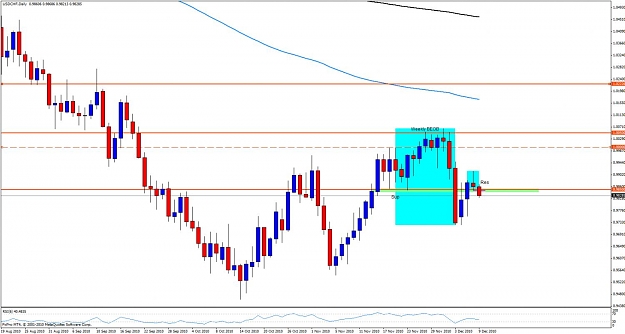
Excellent confluences on this one, dcart. If that PB was a bit bigger and pierced the 1.0000 (red dotted line) you would have had a Mike chart, video and road billboard on this one. . . lol (jk).
Fib levels, 50% ret. levels, trendlines are at their best when they confluence with PPZ levels and/or a Support / Resistance level. The area I have in white looked to be enough of a PPZ level to meet your confluences . .do you see that? . .very nice.
You can see the 1st target in blue gave you that breif retrace. . .better seen on the 4 hour TF. But it hit the obvious target, previous bar highs, quite nicely.
All in all, very nice indeed, dcart.
Attached Image (click to enlarge)
Indicators show the past. Price Action "Indicates" the future.
Well, this H4 breakout got me into the Monthly PB break and looking at the weekly TF, we have a nice flip area that the daily candle may well close above in the next 4 mins. I want to give it a little more room than BE.
EDIT: Sorry. Still half asleep here....I actually traded 0.05 and took off 0.03 and moved the SL to less than the profit taken so, I am actually at BE already without moving the SL to the point of entry. If you see what I mean.
Ignored
I see what you mean Pb . .very nice . .
Indicators show the past. Price Action "Indicates" the future.
Those charts have EVERYTHING: patience,trader psychology,chart+bars analyse,entry points with all the reasons,money management,fta,ppz,targets,but most important the plan.Those charts are priceless trading lessons and I don't have enought words to thank you!
Those charts have EVERYTHING: patience,trader psychology,chart+bars analyse,entry points with all the reasons,money management,fta,ppz,targets,but most important the plan.Those charts are priceless trading lessons and I don't have enought words to thank you!
Ignored
Thanks FX, but you can have it all and things still not work out the way you hope
B/e on this one missed my t/p by 16 pts, such is trading
Thanks for the excellent chart - you make it look easy, but I know that it's not (for me anyway!). Just one question - would you consider the bars to the left to be 'traffic'? I am trying to learn the principles of space and traffic.
Thanks,
Kal
Ignored
Hey Kal
Traffic is relative. This is trading in a box so by the nature there is going to be traffic thus it was reflective in my trading plan.
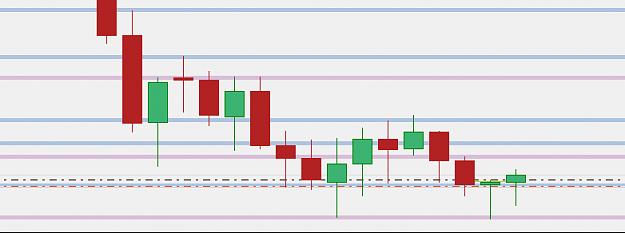
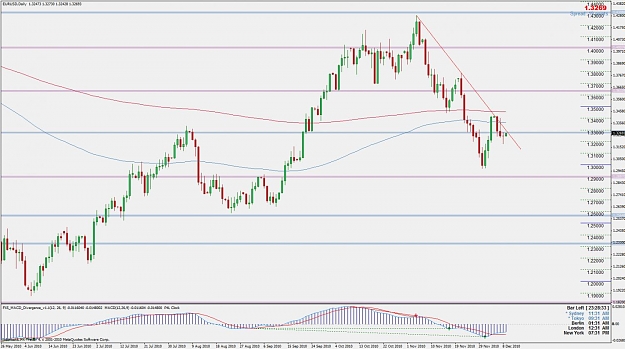
Hello Mike, this was a great trade. Strong bounce of the lower boundary!
Just one thing I would like to bring and ask you for advice, if possible.
I know it may sound stupid, but I think the standard MACD is NOT WORKING.
Well, I consider MACD important as we look for divergence as one of our confluences. So it must be sharp. But look what I see again and again.
These are: Standard MACD MT4, Mt4 MACD Imported, TOS, NetDania.
Only Standard macd show div, when others do not. And those others are pretty much the same. How could that be?...
Ignored
Hey Adi
Not really sure this is going to be something with how each is looking to display the oscillator and whatever the inputs are. Since that is all it is. Just keep it simple if you ask me. Use an oscillator you are comfortable and go from there.
Thanks Mike. As always your simplicity is unparalleled. PA has really changed my trading positively...hopefully in time, I'll be able to analyze the markets like you guys.