And this is another one on EUR/USD. Got a bullish daily Pin Bar yesterday off fib confluence and daily support. Price hit monthly pivot and stall. I identified Twin Bar High. Place buy limit on break and stop below the second bar. But we never got a break. I know the daily PB has a lower close than open, but does it nullify the fact that both open and close are at the upper end of PB?
Any comment would be much appreciated
Mike, thank you very much for your explanation. Yes, so I will add them to my tool box. And I like the way you describe it as "burst" - looking at the charts I think that after the break I would exit on the bar closing, or at least will have to have my SL at BE... many times the break will go some good distance on this "burst" then retrace.
Hi mike.
I have been reading a lot of your posts and can tell you are a very good trader....
Anyway, here is a trade i took today...
Ignored
Hello dk2007,
i believe he trades several kinds..
breakout + pullback + PA off of S/R,
outright breakout (mutliple bar high/low breaks)
wedge breakouts
just keep studying his charts
he'll chime in later, for sure.
regarding your trade.
i guess the ongoing trend is the main culprit here.
the trend, from Oct.14 was up.
there was a minor flip around 1.0140 which u overlooked. (try&plot a line there)
u also had a medium-/long-term downTL that got broken. price bounce from it too, forming a small pin, then a BUOB (additional warning signs).
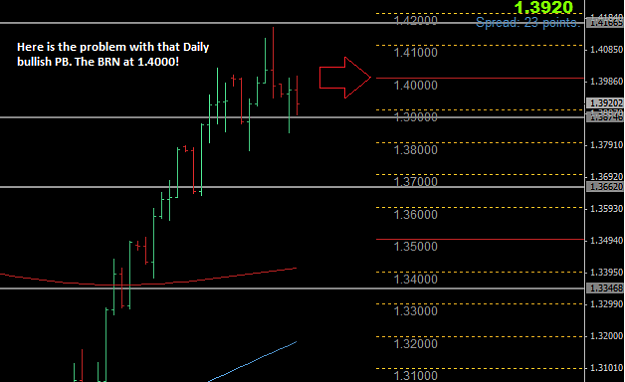
And this is another one on EUR/USD. Got a bullish daily Pin Bar yesterday off fib confluence and daily support. Price hit monthly pivot and stall. I identified Twin Bar High. Place buy limit on break and stop below the second bar. But we never got a break. I know the daily PB has a lower close than open, but does it nullify the fact that both open and close are at the upper end of PB?
Any comment would be much appreciated
Ignored
Here is the problem with that Daily EU PB.
It is right at the BRN.
I know you think you need all those things on your chart right now, I used to be the same.
But, in reality, all that clutter blinds us from seeing PA.
And this is another one on EUR/USD. Got a bullish daily Pin Bar yesterday off fib confluence and daily support. Price hit monthly pivot and stall. I identified Twin Bar High. Place buy limit on break and stop below the second bar. But we never got a break. I know the daily PB has a lower close than open, but does it nullify the fact that both open and close are at the upper end of PB?
Any comment would be much appreciated
Ignored
maybe u can restate your question?
i got really confused,Sir
u must be referring to Monthly R1 @13993, not monthly pivot
why no two-bar high break? maybe because 'it's not yet time' &/or price is too weak to go up for now.
maybe u can post a daily chart too, illustrating that daily PB u are referring to. (we all use different brokers so PA setups may look different)
there was a minor flip around 1.0140 which u overlooked. (try&plot a line there)
u also had a medium-/long-term downTL that got broken. price bounce from it too, forming a small pin, then a BUOB (additional warning signs).
Ignored
Thank you zildjian
Yes i see what you mean. But that was a very small flip. I couldn't see it until i went down to the hourly chart (even then i had to squint). I wonder how you can see this - did you go to lower TF to check any possible flips? If so, how low would you look in terms of TF? If let say you had a PB on the daily, how many lower TF will you look at for flips? And which ones will you place more importance in terms of target?
What is FTA? How is PPZ different from Pivot Point? How to get them on chart?
Thank you
Danny
Ignored
SC seems to have answered all your questions and pointed to where the information is.
I know it sounds taunting with all the posts in this thread but, you can read the main points and also read the materials and watch the videos in the guest area of the private forum.
... But that was a very small flip. I couldn't see it until i went down to the hourly chart (even then i had to squint). I wonder how you can see this - did you go to lower TF to check any possible flips? If so, how low would you look in terms of TF? If let say you had a PB on the daily, how many lower TF will you look at for flips? And which ones will you place more importance in terms of target?
....
Ignored
yes, it was a small flip but worth noting of if u wanna reduce risk to your trades.
seriously, u have to be aware of any/all possibilities. u cant be complacent.
when u cross a street, do u only take note of big humps/potholes or big cars.... & u ignore small humps/potholes, small cars/motorcycles?
i look at/for price flip on lowerTFs, but i saw that flip right on your chart.
if u need to squint, then it's either u have to use eyeglasses &/or reduce the number of lines on your chart or change the line colors. or u can simply zoom in/out the chart.
u can look at any TF. the only difference is the number of bars increase as u go lower, but the price is the same.
of course, the higher TF PPZs, S/Rs are more important.
if u need to squint, then it's either u have to use eyeglasses &/or reduce the number of lines on your chart or change the line colors. or u can simply zoom in/out the chart.
Hope that helps
Ignored
you've just made me laughed but maybe that's what i should do.
It certainly is a concern having so many lines and levels to watch out for on the chart.
That's what i love about this thread. The people are great !!
Thanks SC & Pinbar !!
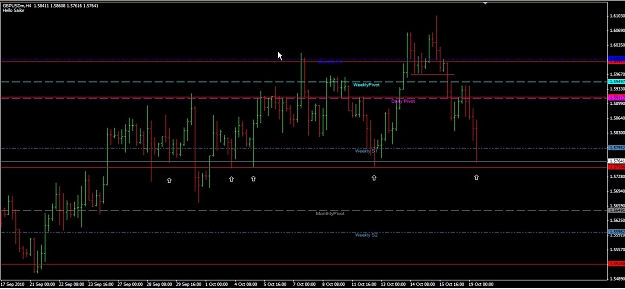
Was backtesting and saw this pin at a swing low + off the ppz on the H1 GBPUSD chart. I anticipated price to push back up to the 1.5867 area which was the next PPZ level i identified. However, price did go in that direction but didnt quite reach it. The pin was subsequently invalidated.
How do you guys manage this problem of price almost reaching your FTA then turn around to go the other way? Personally I thought this pin was pretty decent and had a good chance of hitting at least the FTA.
I am still learning and learning and learn
please can mike or anyone tell me what happen to this my trade? what I dd
wrong? I took the trade after the formation of the pin I marked with the arrow
please I want to learn from the mistake.
Attached Image (click to enlarge)
Much love
Emmanuel
If you don't control your emotion it will control you.
....
Was backtesting and saw this pin at a swing low + off the ppz on the H1 GBPUSD chart. I anticipated price to push back up to the 1.5867 area which was the next PPZ level i identified. However, price did go in that direction but didnt quite reach it. The pin was subsequently invalidated.
.....
Ignored
some observations:
-the pin was pretty average in size (compared to previous bars)& the close was below the open. but there certainly are pins like this that work well.
-this was a H1 chart. ideally, we start trading H4 & up, as lower TFs are pretty whippy & fast.
-cant see clearly, but the distance to the nearest ppz (15867ish, upper red line) is about 10pips? that gives u very little room...
as much as possible we avoid trading into very near traffic zones like this as it can make price reverse on us, sometimes very quickly, leaving u little room to react. (notice the subsequent bar reversed quickly & formed a bearish bar, often this is a warning sign of a bad &/or soon-to-fail trade)
also, remember a PPZ is a zone, not a specific price. price can come near it, touch it to the pip or breach it before reversing.
find out which one happened in that trade.
-if i took this trade, i might have ended it with a full-bar loss.. or a minor loss, since i usually check PA on lower TFs.
I am not Mike by any means, but I can see the main problem.
Not many J16 people use pivots, because while they sometimes line up with PPZ, they are not the same thing.
Looks like your DBHLC actually hit the FTA where BE or taking some off the table would have been in order.
Ignored
He also sold right into a pullback towards the breakout of the 4H-TL, on his chart you'll see a PB-ish BUOB confirming a succesfull retest of the broken down-TL.
He also sold right into a pullback towards the breakout of the 4H-TL, on his chart you'll see a PB-ish BUOB confirming a succesfull retest of the broken down-TL.
Ignored
Yeah, but, it wasn't a PB when he sold so he could not know it was a pullback.
I agree, the TL should have been the warning sign along with the PPZ.
Yeah, but, it wasn't a PB when he sold so he could not know it was a pullback.
I agree, the TL should have been the warning sign along with the PPZ.
Ignored
What I meant was that after selling the Loonie he could have closed his position for a small profit or loss (depending where he got in) when he saw that PB @ the TL, realizing that his initial thought on selling the Loonie was wrong. The next bar after the PB was a bar engulfing the PB and that should have really made him close his shortposition.