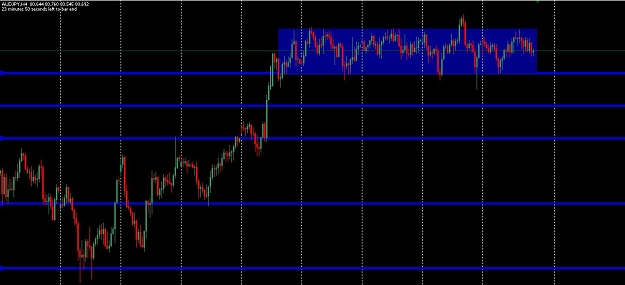
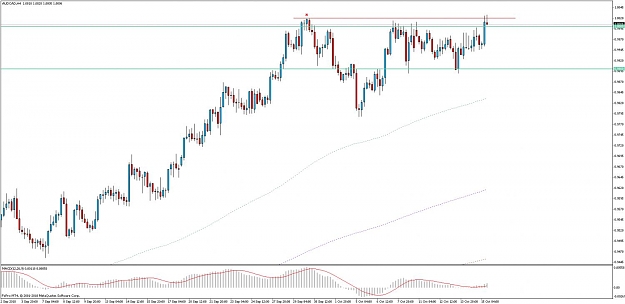
looks at this AUDJPY consolidation. I can only imagine how beautiful that breakout will be :-)
cheers
Ignored
I would be more interested if we didn't already see a break of the high and low of the box. It could give a nice move from here but with these breaks already I personally would not see it as a breakout opportunity now.
No trades for me in a whiile now as not seen any decent setups.
The news guys always make me laugh, like to today . ."well Larry, looks like the market likes these numbers that came out today . ."
Why can't they say something like this . . ."Well Larry, that Weekly DBLHC hit its FTA now it looks like its going for those Highs at the 10700ish"
. . "That's right Bill we should be getting a reaction there . .if not we may find new Support . .back to you Larry . . "
lol
Ignored
Just an update . .
Attached Image(s) (click to enlarge)
Indicators show the past. Price Action "Indicates" the future.
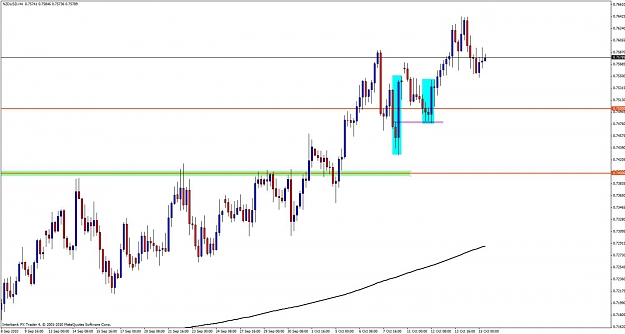
NZD/USD H4 BUOB Retrace to previous resistance
I took this trade a couple of days ago sorry for delay in posting.
Entry 0.7510
SL 0.7480
TP 0.7510
Moved to Be/E to quick really at 0.7532 took half off
Reached Target for remainder
Buob
strong uptrend with 3 distinct touches
Retrace to 0.7500BRN -PPZ 61.8 % Fib
Please Critic where needed so I can continue to improve
I use 3 clicks to size picture if it needs changing larger or smaller please let me know.
Thanks
D
Looks great and really thought out. I like an entry on the retrace say at the BRN 7500, and then a stop around 7445, under that min trendline, under the 50 round number and under the left lows of that bigger buob too.
But like the way you used all the core concepts to generate a trade plan. This is great stuff
Mike
Ignored
I agree Mike . . .well planned out. Nothing wrong with move to B/E quick, in my book . .
On a side note . .
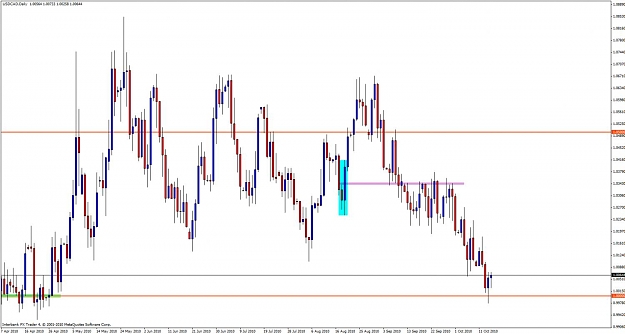
Something I observed about Outside Bars that don't immediately retrace to their previous bar, before or after they break.
One thing is the obvious why they don't retrace, that they have a lot of momentum, like all quality PA setups, and they just break hard and never look back. But if they don't retrace to their previous bar High/Low, that level tends to be a strong area to watch.
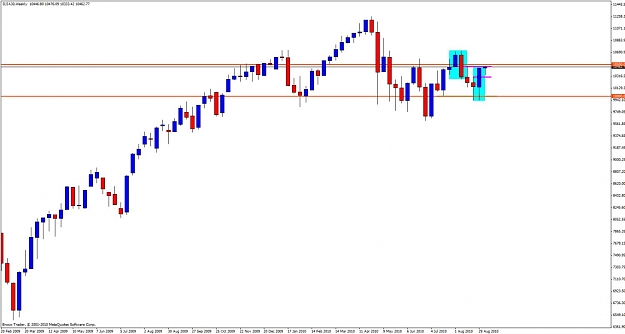
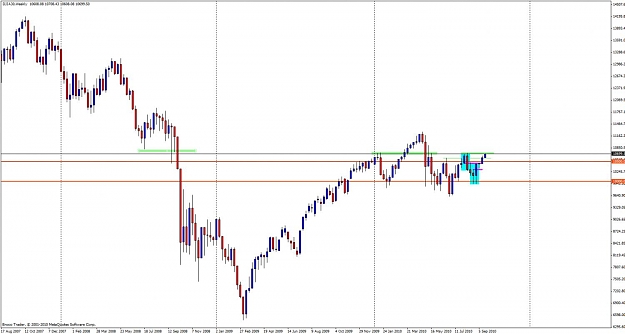
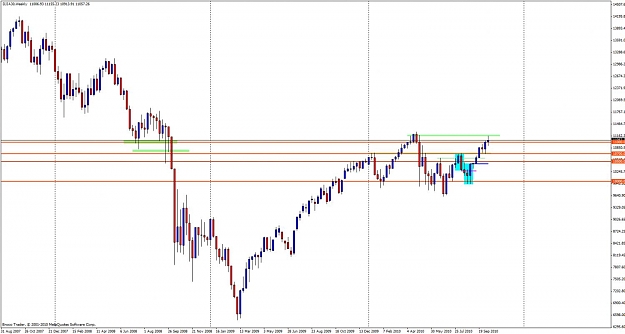
For example, the big BUOB just prior to damien's BUOB. Price eventually retraces back down to the previous bar High (purple) and finds Support . .bypassing the 1.7500 BRN. You would think the 1.7500 would have offered that Support.
Another example, Usd/Cad Daily BUOB. No retracement before or after the break . .Price breaks hard and runs. Price eventually works its way downward and finds Support . . then Resistance . . Where? At this BUOB's previous bar High . . interesting don't you think?
Attached Image(s) (click to enlarge)
Indicators show the past. Price Action "Indicates" the future.
Joined Mar 2008
|
Status: shoe shine boy
|1,146 Posts
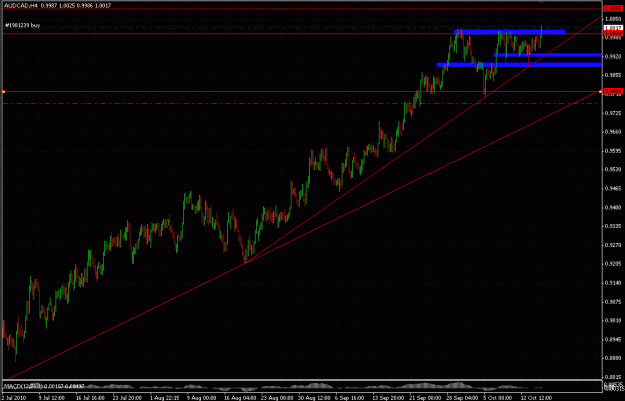
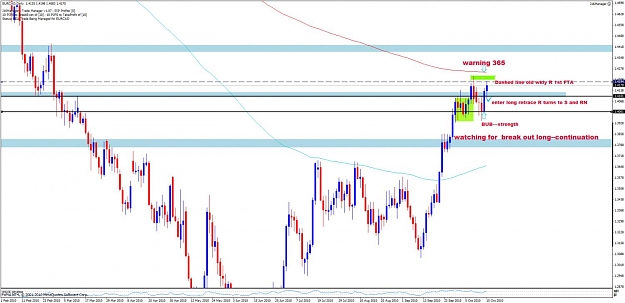
Hello , Anyone looking at the AUDCAD chart?
The price is flirting with the 1.00 BRN right now. I like the weekly chart a lot , especially those spikey lows forming some kind of SHS and the broken neckline at the 98. There is a double high at 1.00 aswell which could be easily broken with current strong up momentum .....The price just burst thru the 1.00 level after testing it a lot of times. FTA at 1.0080 area.
|
Joined Mar 2010
|
Status: Trade Smart
|577 Posts
Hi Greenhaze,
Beware cause we had on the 30 Sept a fake breakout which you can see on the chart, I would recommend only taking a buy when price closes above the red line (fake breakout high)
The power of the daily ...retrace for continuation long off RN and S which was once R
I have been on this thread since approx Jan/Feb 2010...my learning and trading have come along very well...for those who are just popping in or struggling ---hang in there and spend some time here ----there is great opportunity and some fantastic people to help you ...like you have read ...it just takes time, patience and discipline.
Learn the basics and build from there. It has all been said before but to reiterate find one or two things that work for you and refine it. IMO don't try every trade in the book until you master one or two....I believe that you can make a go at this with just those one or two setups if that is what you wanted to do.
Thanks to James and all the seniors and people who ask questions!
I agree Mike . . .well planned out. Nothing wrong with move to B/E quick, in my book . .
On a side note . .
Something I observed about Outside Bars that don't immediately retrace to their previous bar, before or after they break.
One thing is the obvious why they don't retrace, that they have a lot of momentum, like all quality PA setups, and they just break hard and never look back. But if they don't retrace to their previous bar High/Low, that level tends to be a strong area to watch.
Beware cause we had on the 30 Sept a fake breakout which you can see on the chart, I would recommend only taking a buy when price closes above the red line (fake breakout high)
Comments are welcomed.
Os.
Ignored
Hi Osman.
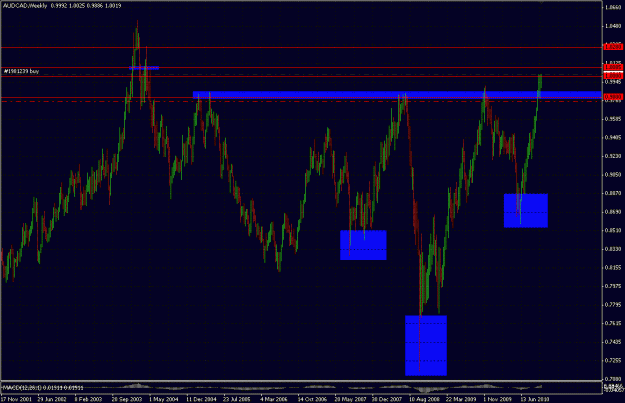
The position is really small right now and i keep my eyes on last highs at 1.00 area and the way price reacts to them. I like to be in a trade with small position when i anticipate a breakout ,somehow it puts me in the harmony with market ;]. Right now i am pretty confident in those longs and i guess there are some stops below to be taken but weekly chart is screaming long overall.
GREAT Charts Jim...I Always enjoy your stuff...the news commentators junk is just to funny...They should be saying ..."well it looks like we don't know what the hell is going on with the markets....maybe we should get the Jarroo fella in here"
Either way, it probably doesnt matter. There are such a wide variety of market participants with such a wide variety of approaches which incorporate such a wide variety of MAs, timeframes and calculation methods that the little differences are unlikely to mean much at all.
Ignored
Hey Joelcf,
Sorry, it works also for the EMA. The only difference between a EMA and SMA is that the first applies a weighting factor, this weighting factor for each data variable decreases exponentially and never reaches zero. The older the obeservations the less important its contribution will be to the value of the EMA so to say. Now for the calculation of a 100 EMA it doesn't matter if we have 100 sucessieve 4H-bars or 100 successieve every 4th 1H-bar. In both calculations the bars gets weighted by exactly the same factor, because its position among the 100 data variables is the same. Look at it this way, isn't the close of every 4H-bar (in the 4H-TF) the same as the close of every 4th 1H-bar (in the 1H-TF) ? Sorry to bother you with this all but I wanted to be sure that everything is understood well.
I spent the last couple of hours reading messages on your thread and it is very informative. Thanks for creating this thread and your contributions. I have a basic question. How do you personally determine if the trend is up, down, or in a range? What method do you use to determine the direction when you are looking at a bare chart without indicators? If answering this question will take too much of your time, can you please point me to where I can find the answer on the forum? Thanks for your help.
NYCDweller
Ignored
Hey Dweller
For me I keep it very simple. If the trend is up it will run from the bottom left to top right. If it is down, from to left to bottom right. Everything else is sideways. I keep my charts at the same zoom, so I know the trend in relation to what I am looking at.