Maybe you shouldn't ........ha ha. Stopped out about ten minutes ago which gaurantees a huge move to the upside any moment.
Nathan
Ignored
I was going to post a chart but that's a tough pair to get a handle on for me right now. I'll trade on short TF's with great set ups but the PPZ's on this area are wide and in some instances not very defined. My gut says to trade it short when I can just because of the trend and GBP weakness.
I was going to post a chart but that's a tough pair to get a handle on for me right now. I'll trade on short TF's with great set ups but the PPZ's on this area are wide and in some instances not very defined. My gut says to trade it short when I can just because of the trend and GBP weakness.
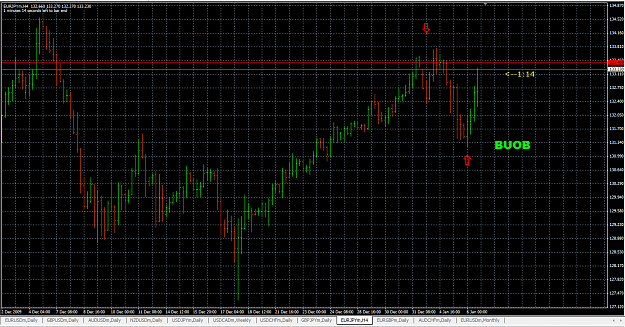
No worries. I saw this but passed. I didnt like how it had a weak close, and did not close above 132. Sure this is picky, but I know this helps me manage my trades better and most likely gives them a higher probability of success ( which is all I really am lookign for when trading).
Learn from your mistakes and become more and more comfortable developing your trading style. IT is only the 6th day of the year and the 3rd trading day, there will be many many more setups better than this one to come.
|
Joined Jul 2009
|
Status: defender of clicking too soon
|27 Posts
Nathan Re the gbp/chf trade.It looks as though you were looking at the
1 hr TF which shows a possible breakout to the upside which immediately turned into a bearish pin.If you go out to the weekly TF the chart shows a
downtrend for quite a while.Its a very clean chart hitting several s/r on the way down.Even a few mbqb 11 type multiple bar breakdowns.
The current activity showa a rebound high of 1.8087 to a low of 1.6115
a difference of 1972 pips.Taking that diferrence from the current high of
1.7108 which is also within a double top you get a price objective of 1.5136 vs the pivot low of 1.5115.The measured move calc is nothing more than 50% fib calc.
I dont know if this helps,but that is what I saw when observing the Gbp/Chf
Tom
Conquer the beast with disciplined determination
and intellegent control.
yes dmc i've been told that .. about this trade youre right i didnt pay atteniton that the BUOB didnt close higher than 132 and it could ran into resistance. Am i right? I mean this is why you didnt take the trade right?
My thing is this, there is nothing wrong with this trade if you took it, the result of it proves that. I am sure if I took it I would find a millions things right with the trade and why everyone should have taken it.
But my thing was 132 is a Round number and a decent S/R level if it closes above that I can look for a strong break and then perhaps move my stops up behind that level of resistance turned into support.
Another hting this trade had goign for it was the 150 and 365 EMA levels that ran right through it. This also made the trade tempting.
Hopefully I am clear inthe way I was thinking and you can take or dismiss whatever youd like :0)
yes dmc i've been told that .. about this trade youre right i didnt pay atteniton that the BUOB didnt close higher than 132 and it could ran into resistance. Am i right? I mean this is why you didnt take the trade right?
Half position closed, 50 pip trailing stop applied to remainder of position.
Ignored
update on this touch trade: still pulling south, trailing SL currently sits @ 1.5709, bringing my 50 pip trailing S/L 21 pips into profit. Feels good man.
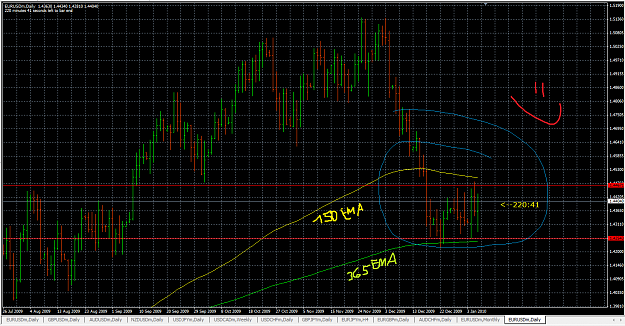
me again I have a noob question about the EMA. I saw that james16 also uses EMA (150 and 365) in some of his videos and i would like to know why is it important? what happens when the price reaches the EMA? I never used EMA as an indicator so i dont know much about it ...
me again I have a noob question about the EMA. I saw that james16 also uses EMA (150 and 365) in some of his videos and i would like to know why is it important? what happens when the price reaches the EMA? I never used EMA as an indicator so i dont know much about it ...
Ignored
If you throw a 150ema, and/or a 365ema on your charts, you will see how those ema's tend to act as support/resistance areas (ppz's), regardless of the time frame. I see this most commonly on the 1hr charts (correct me if I'm wrong on this), although it is a very solid piece of a data to add to your charts to add confluence to a PA bar pattern.
If you throw a 150ema, and/or a 365ema on your charts, you will see how those ema's tend to act as support/resistance areas (ppz's), regardless of the time frame. I see this most commonly on the 1hr charts (correct me if I'm wrong on this), although it is a very solid piece of a data to add to your charts to add confluence to a PA bar pattern.
at first I didn't like the EMAs on my chart, but lately I have noticed more and more how they help add to confluence to decision making. Using the EMAs alone is not a good idea, but combining the ema with other factors = effective.
Nathan Re the gbp/chf trade.It looks as though you were looking at the
1 hr TF which shows a possible breakout to the upside which immediately turned into a bearish pin.If you go out to the weekly TF the chart shows a
downtrend for quite a while.Its a very clean chart hitting several s/r on the way down.Even a few mbqb 11 type multiple bar breakdowns.
The current activity showa a rebound high of 1.8087 to a low of 1.6115
a difference of 1972 pips.Taking that diferrence from the current high of
1.7108 which is also within a double top you get a...
Ignored
Tom:
I will post a chart tonight, it was traded off of the daily using the pivot at 1.6500, ascending trendline at 1.6500 area and 61% fib from the last move up between October 13th and November 17th. Also, the last time it touched that pivot area it blasted up with a buob.
You can't win them all, I don't lose sleep about it. I am still well up in my account (but down 1.5% for the month of January), just disappointed with my performance YTD after 11 months of consistent profits and a really strong October and December in 2009.
Like I said, I really need to post a chart and will do so tonight. I almost always wait for price action even at what I consider good levels. In this case I took a pin that was not truly a pin (due to my belief in the level/pivot area holding), so this was a good reminder to stick to my original plan. I think the last quarter results in 2009 possibly affected me, as I had close to an 80% win rate (along with a streak of 7 or 8 winners in a row) and perhaps grew too sure of things. Had I waited for a true pin (close within the previous bar) I would have not entered an order.
Let's be honest though, there is still a good chance this pair bounces off of this pivot and heads north. Time will tell, I just may have been too aggressive with the timing of my entry.
woow this is incredible i tested it immidiately on EU and i couldnt belive my eyes ... it really does work as s/r areas
i attached a screenshot ( i already had the s/r areas drawn and it seems to fit perfectly with them ) Attachment
Ignored
They are great tools for you PPFX. If I remember correctly, Jim teaches that they should be used in confluence with PA. Pull a chart, go back and look at the way that a pin for instance will deliver the goods off of the 150 when it is in confluence with S/R or a major fib level. Also, note the "first time back" phenomenon of price off the 150ema. This material alone can keep you busy for years. It's good stuff!