Joined Feb 2009
|
Status: Borderline yahoo & oh-no!
|6,607 Posts
Quote
Disliked
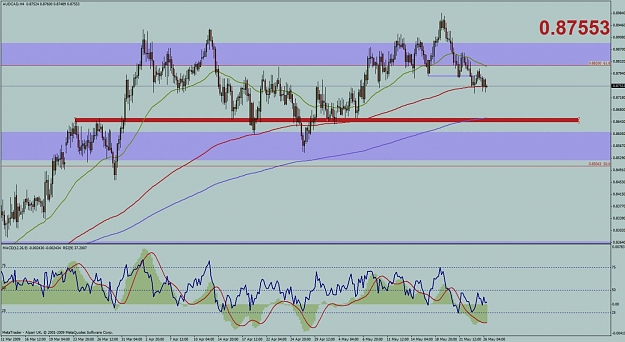
Looks like a keeper. I like the 8650ish level as a 1st target.
jarroo.
Feels like 0.86 - 0.8650 is achievable near-term.
Massive bearish divergence on MACD on the daily.
Let's see how far the weekly BEOB's influence goes.... Mean time, 0.8730/40-ish (PPZ from as recent as april1, & as far back as sept2007 on my daily chart, XTB MT4 data) & 0.87 roadblocks seem to be causing some problems.
Looks like a keeper. I like the 8650ish level as a 1st target. (sorry can't post charts).
Ignored
agreed its backed up by the 365 EMA on the 4h TF also.
one thing i notice is the bullish div. on the 4h TF, so we might have to endure some retrace??
EDIT: added chart
Joined Feb 2009
|
Status: Commercial Member <- Don't trust me
|2,976 Posts
This is my question, I am not sure if someone has asked this before. My broker is GMT+2, how can I show a Daily Chart of GMT +0? Is GMT +0 the best Daily chart setting here? Thanks a lot.
Joined Feb 2009
|
Status: Borderline yahoo & oh-no!
|6,607 Posts
kk007,
if u want a GMT +0 chart, look for an MT4 with such timezone.
I think IBFX & Alpari are both gmt +0. (not sure now that we have daily savings time?)
with the james16 method, timezone does not matter.we trade the PA we see in our charts, no matter what time zone. of course it helps if u have & are monitoring 2 or more brokers, as each broker displays different PA.
This is my question, I am not sure if someone has asked this before. My broker is GMT+2, how can I show a Daily Chart of GMT +0? Is GMT +0 the best Daily chart setting here? Thanks a lot.
Ignored
Not sure but many of the guys here use daily charts from FxPro as the daily close lines up with the close of the NY trading session.
Joined Feb 2009
|
Status: Commercial Member <- Don't trust me
|2,976 Posts
Thanks supremeChaos and Adam777,
I am using AlpariUK and that is GMT +2 at the moment (GMT +1 during winter). If using NY close as day end , it will be equalvanlent to GMT +3 (since it close at 21:00GMT at the moment).
Seems to me that not a big issue here anywhere between GMT +0 and GMT +3.
Joined Feb 2009
|
Status: Borderline yahoo & oh-no!
|6,607 Posts
g_j_hook@yah, bundyraider,
seems it's a PPZ from as far back as July2007. (haven't checked Fib, etc.)
in my case, 1.38 & 1.3850 were possible supports(based on my doodling). unfortunately, i was not in the trade (again? ). fortunately, my analysis was somehow correct.