Would any of our resident experts like to form an opinion of the chart attached below.
Reluctance to close above 1.9660 for 3 months, pinbar followed by an IB that looks certain to beak down.
Would any of our resident experts like to form an opinion of the chart attached below.
Reluctance to close above 1.9660 for 3 months, pinbar followed by an IB that looks certain to beak down.
Ignored
on this time frame, i see this simply as consolidation/range/congestion/noise.
Would any of our resident experts like to form an opinion of the chart attached below.
Reluctance to close above 1.9660 for 3 months, pinbar followed by an IB that looks certain to beak down.
Ignored
use stochastics 5,5,5
you will see the bigger picture. this market is overbought and wont see 200.00 anytime soon
is anybody using one of the three vegas-systems? if yes, what are your results? i read the vegas documents yesterday and wondered if it it is really profitable.
is anybody using one of the three vegas-systems? if yes, what are your results? i read the vegas documents yesterday and wondered if it it is really profitable.
Ignored
Hey FxFreak,
I think your best bet would be to post this question in the Vegas forum area. Probably those that use it like yourself would miss your question here.
I stumbled across his stuff when I first found these forums, and although I don't use it, it was so important to me that for once I could see their was more to the markets, and different ways to interpret the market(regardless if his methods are profitable or not). It got me for the first time to really think about the markets in a whole new way.
Joined Jul 2006
|
Status: Charts + PA > *
|3,251 Posts
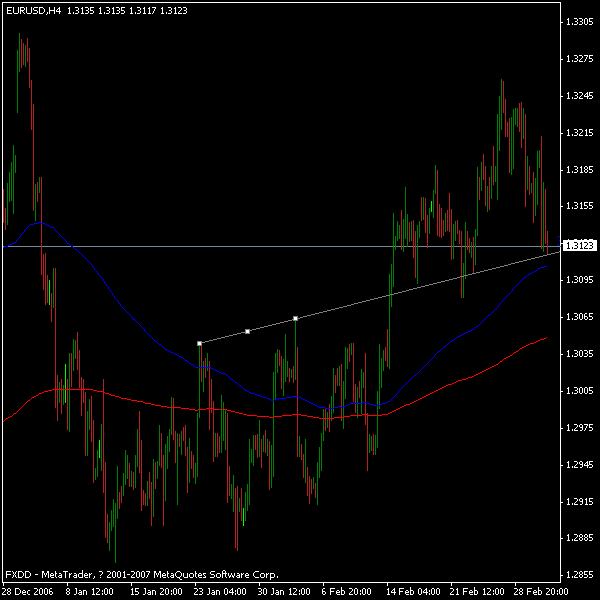
I have no idea if anyone has ever read anything about this before or whether this is just as freaky a thing as the golden ratio and market symmetry.
However, this is something I have also seen happen several times over the past year and it's a bit crazy, but still something to look out for...
Here's the deal: whenever a wedge / two trendlines intersect, they seem to create a possible "break point", i.e. the intersection itself seems to be a crosshair for a potential breach.
Now I know this sounds hocus pocus, but I think it's one of those "time and price coming together" things, that just oddly enough just seems to occur.
Here's the example for cable, and I have not curve fitted these trendlines, these have been drawn in during the last 4 weeks, before the drop.
Joined Jul 2006
|
Status: Charts + PA > *
|3,251 Posts
If anyone knows anything about this or has seen this before or anything at all, just shoot me a PM or mention whichever book has something about it, I'm just curious
If anyone knows anything about this or has seen this before or anything at all, just shoot me a PM or mention whichever book has something about it, I'm just curious
Derived from the line chart:
Ignored
how is that any diffrent than a triangle that breaks to the downside?
how is that any diffrent than a triangle that breaks to the downside?
Ignored
My emphasis was on the breaking point. The intersection of the TLs very often seems to be the "soft" spot. I don't really know why, but it's just come to my attention. Might just be a coincidence, I don't really know, hence I'm curious.
Besides, the markets driving me nilly-willies with its unwillingness to do anything after Asia, so I need the distraction
I have no idea if anyone has ever read anything about this before or whether this is just as freaky a thing as the golden ratio and market symmetry.
However, this is something I have also seen happen several times over the past year and it's a bit crazy, but still something to look out for...
Here's the deal: whenever a wedge / two trendlines intersect, they seem to create a possible "break point", i.e. the intersection itself seems to be a crosshair for a potential breach.
Now I know this sounds hocus pocus, but I think it's one of those "time and price coming together" things, that just oddly enough just seems to occur.
Here's the example for cable, and I have not curve fitted these trendlines, these have been drawn in during the last 4 weeks, before the drop.
If anyone knows anything about this or has seen this before or anything at all, just shoot me a PM or mention whichever book has something about it, I'm just curious
Derived from the line chart:
Ignored
Hi, I see it as a long break first as well.
I did a course a few years ago and was told that when penants or triangles are formed that if they didnt break before the last third of the triangle or penant that it was more likely to fail which is what happened on this long break.
The lady who said this was the vice president of the Australian Technical Association