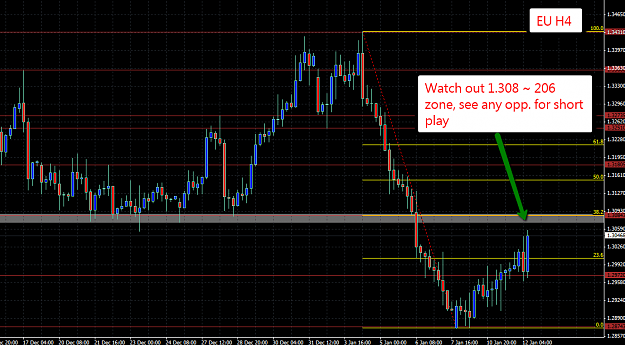
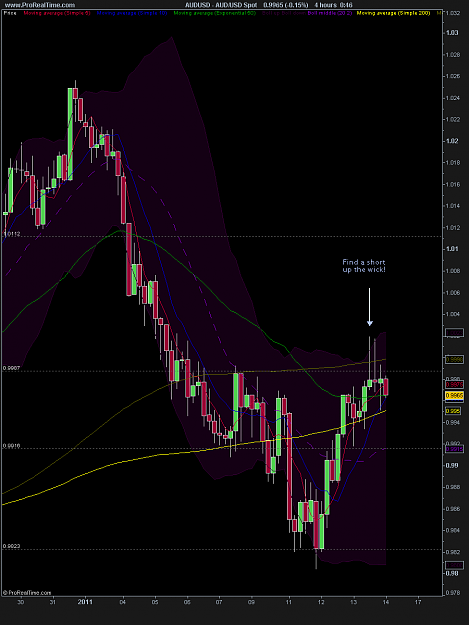
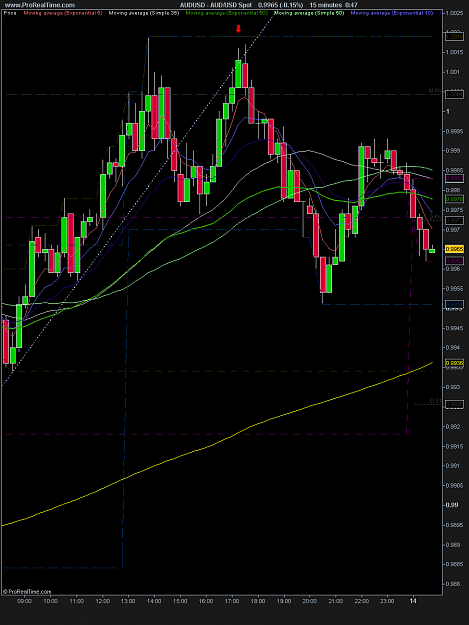
Got asked about this trade so posting the chart.. the 4H gave a pin in a key area for A/U (clearly visible on the daily or a zoomed out 4H) so you look for a short up the wick of the pin, 15M shows entry.
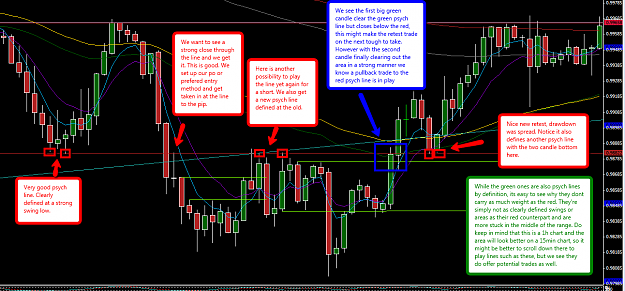
Here is a chart from au the recent days. The red line is just a real treat, thats a great line, psych or not.
The green areas is what im wondering some more about though. Clearly they're not as strong as the red one, but how are these lines approached? They're probably naturally more prone to quick scalping which might be another point for toggling down to our 15min and trading those type of "rangy" lines from there.
Is there some general rule that could be applied to filter out which psych lines to play and which ones to pass? They do happen quite frequently and of course confluence at the lines are always good and session characteristics as have been mentioned is also important.
Got asked about this trade so posting the chart.. the 4H gave a pin in a key area for A/U (clearly visible on the daily or a zoomed out 4H) so you look for a short up the wick of the pin, 15M shows entry.
Ignored
Lovely trade Doc, great use of the higher TFs for analysys and lower TF for honing a tight entry point.
The two candle formation toward the top of that pin formed a bearish engulfing pattern on Alpari, not quite as it looks on your charts. That, added into the mix, is surely all you need to chose the right direction and make some money.
Here is a chart from au the recent days. The red line is just a real treat, thats a great line, psych or not.
The green areas is what im wondering some more about though. Clearly they're not as strong as the red one, but how are these lines approached? They're probably naturally more prone to quick scalping which might be another point for toggling down to our 15min and trading those type of "rangy" lines from there.
Is there some general rule that could be applied to filter out which psych lines...
Ignored
Hi
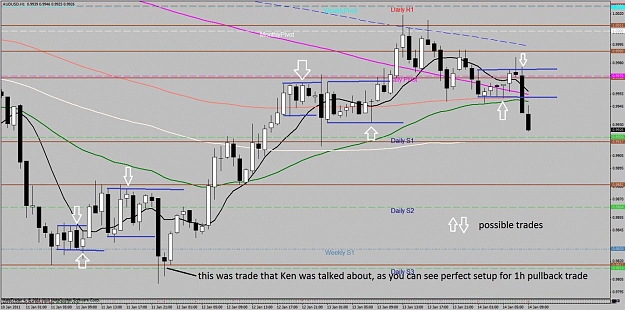
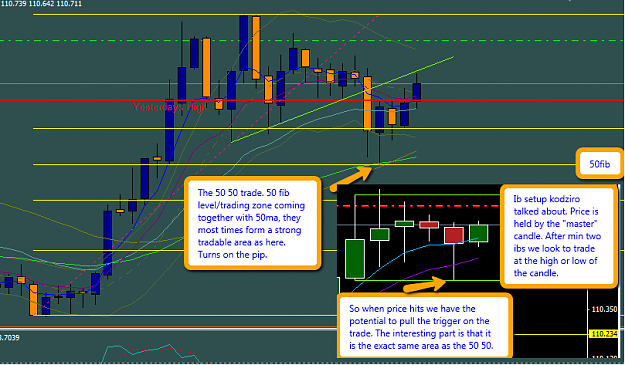
Do you remember when i talked about 1h IB trading opportunity, and when I got min 2 of them i consider to take a trade at end/near of range area. Your green lines represents such a trades. Generaly i trade them after 4h/ daily PA with direction of this PA movement ( mostly turning major PA )or with direction of 1h 50 ema or possible top/bottom. I like to see also when candle try to break with this IB range ( because i know then what line held the price ).
So be aware of that line, you don`t have to filter them. Remember of session characteristic if you decide to trade with them. Some of them could be sub IB`s of bigger swings IB`s.
Pain attention also at inside days.
As for psych lines you recon. it well there. Confluence and session time is important. If you don`t see any wait for 1h rejection, check 1.0011 it was daily high earlier and got 10 day ma nad pivot monthly so why not to try short there ( session time was good also ).
Remember also that you can`t be 100 % right, it happen to got SL ( but we got proper R:r ) . I got stopped at gu today at 5820 after london i want to play just like yesterday, after i see next 1h close reenter was natural.
Do you remember when i talked about 1h IB trading opportunity, and when I got min 2 of them i consider to take a trade at end/near of range area. Your green lines represents such a trades. Generaly i trade them after 4h/ daily PA with direction of this PA movement ( mostly turning major PA )or with direction of 1h 50 ema or possible top/bottom. I like to see also when candle try to break with this IB range ( because i know then what line held the price ).
So be aware of that line, you don`t have to filter them....
Ignored
Thanks kodziro! Cracking stuff once again
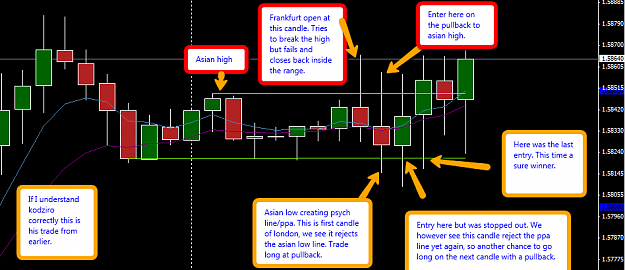
Funny enough me and drmongolia talked briefly on those ib setups last night as we're currently all over you charts and explanations We also took notice of the 1.0011 as you mentioned. You also mentioned gu and that had one of those nice frankfurt asian high rejection pullback trades this morning, you've mentioned those a time or two earlier as well.
This ib refreshment make another aspect of all this clearer. Since i found this forum and this thread I always pay extra attention to you and kens post, and i know im not the only one.
I've read, heard, and seen that the .xx80 .xx20 are strategic areas as well and I would guess that this is due to their defining the fade trading zone. The red line on your chart sure confirms that the .xx80 is an important area.
Then it seems that the more times it bounces off of this area and other traders draw this same line, it tends to be a self fulfilling prophecy.
Do you remember when i talked about 1h IB trading opportunity, and when I got min 2 of them i consider to take a trade at end/near of range area. Your green lines represents such a trades. Generaly i trade them after 4h/ daily PA with direction of this PA movement ( mostly turning major PA )or with direction of 1h 50 ema or possible top/bottom. I like to see also when candle try to break with this IB range ( because i know then what line held the price ).
So be aware of that line, you don`t have to filter them....
Ignored
I found this to be interesting. Noticed it after reading kodziros post.
Its ej just now. Big chart is 15min and black cut in chart is 1h.
I love it how we can all be looking and analyzing price through different lenses but still end up watching the same exact area, to the pip! :nerd:
I've read, heard, and seen that the .xx80 .xx20 are strategic areas as well and I would guess that this is due to their defining the fade trading zone. The red line on your chart sure confirms that the .xx80 is an important area.
Then it seems that the more times it bounces off of this area and other traders draw this same line, it tends to be a self fulfilling prophecy.
Ignored
Yeah, and about that line. Look at the 1h au close and retest it just had. Straight forward easy trading
This looked like a good setup for a long..
First entered on 62 touch and got stopped out.
Next I entered on next candle after. Hangman candle.
Went down wick 20 pips and ended up getting out at -2 to be safe. Its News friday and anything could happen. Was close to news time.
The only system that will work is one designed by and for yourself.
This looked like a good setup for a long..
First entered on 62 touch and got stopped out.
Next I entered on next candle after. Hangman candle.
Went down wick 20 pips and ended up getting out at -2 to be safe. Its News friday and anything could happen. Was close to news time.
Ignored
Friday also tends to be the time for "squaring up" which has a tendency to instigate counter trend moves from what I've seen.
Joined Nov 2008
|
Status: Trade Inspiration Not Despiration .
|4,827 Posts
here is a small pdf on FIB use , By Alconda, He is a advocate of fib use and uses them exstensivelly in his analysis. His entries are solid and using some of this information aids in his abilities to hold for decent profitn targets. I offer this up as something to keep your eye on and prove to yourselves.
You will notice that he doesn't flip his fibs over just runs them one way so the numbers may not match the text , But the levels are the same.
Ignored
I like the fib reading in the J16 thread. Especially the concept of "fib confluence levels".
I like the fib reading in the J16 thread. Especially the concept of "fib confluence levels".
Ignored
I know you can't see them but Chris Lori also talks about that in his videos. Swings within swings and look for levels that coincide. If you get some nice ppa or a pivot at the same time.....happy days are here.
I know you can't see them but Chris Lori also talks about that in his videos. Swings within swings and look for levels that coincide. If you get some nice ppa or a pivot at the same time.....happy days are here.
Ignored
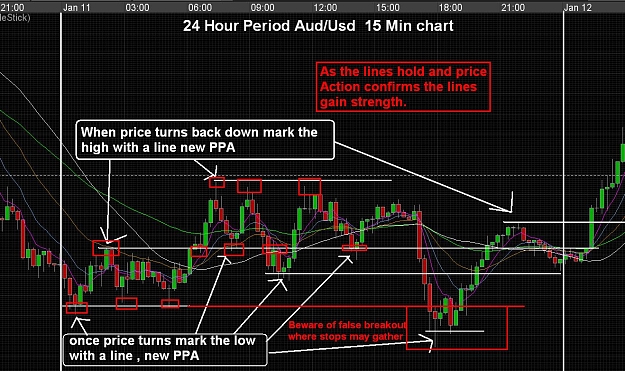
Yes , I had been trying to show some of that in a few charts. PPA from a long time ago is very good. especially , peaks and valleys. but a 15 min chart basiclly shows one 24 hr period of trading and many entries and areas of interest can be seen.
This being the CURRENT areas of concerns hold some decent value.
As you can see in this chart MA's didn't help a lot in this ranging market , But current PPA could lead the way. You can see the large short run that got stopped where stops from the first swing should be.
If we got nothing from that market makers video . This should be the main point to watch for these areas . they can be imporatnt to different camps for different reasons. Run stops for easy money and also enter longs , as the sell orders were needed to help fill a long order.
Wiether we believe any of that or not. doesn't matter i have seen it unfold many times . just gave me a reason to add strentgh to the idea.
Yes , I had been trying to show some of that in a few charts. PPA from a long time ago is very good. especially , peaks and valleys. but a 15 min chart basiclly shows one 24 hr period of trading and many entries and areas of interest can be seen...
Ignored
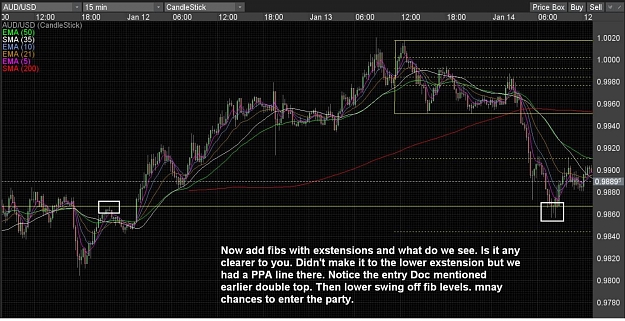
I've been enjoying those fake breakouts lately. I've noticed that more often then not they give very obvious signals. Here's a few thoughts on that particular trade (the Jan 11th A/U fake breakout):
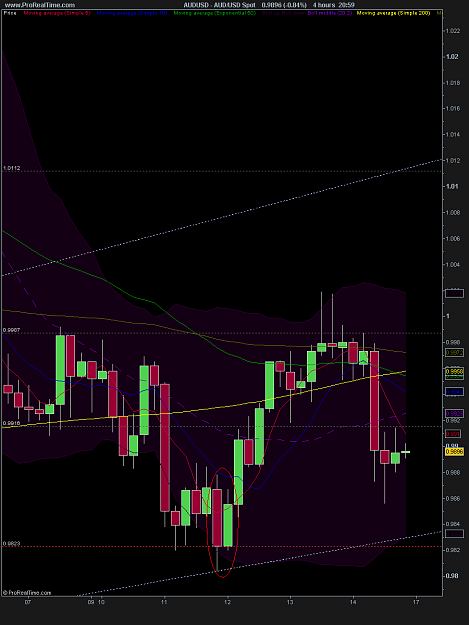
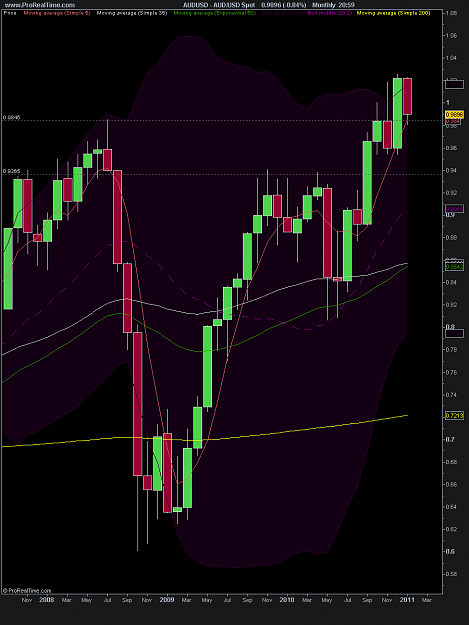
Here's my 4H chart (GMT), that line at 0.9823 has been there for quite a while, you can see why if you zoom out a little (the TL is new though). Just looking at the 4H chart it would be impossible to catch that move right on the touch (again, that TL wasn't there yet). But if you noticed where price closed (rejected support) you could consider a long by dropping down to the 15M and finding PA. More likely you would wait for that DBLHC to complete, then you've got an obvious long signal and you could enter off the 15M at around 0.984X.
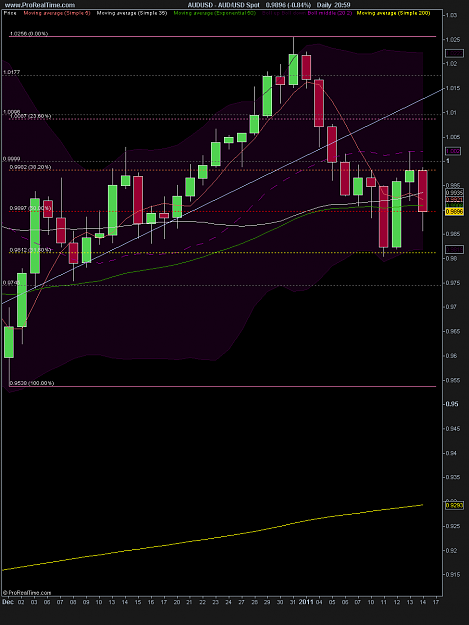
BUT, if you look at the daily and above, there are very obvious reasons to take that trade much lower. Here's my daily, it gets a little messy so I keep 1 daily chart with fibs drawn on it and 1 clean daily chart. Price hit the 61.8% fib level and only went 8 pips past it. So if you notice that, you could take the long either at the close of that 15M pin or wait for the pullback into the wick a couple of candles later. Or even wait for the close of the first candle to close across the 5ema on the 15M.
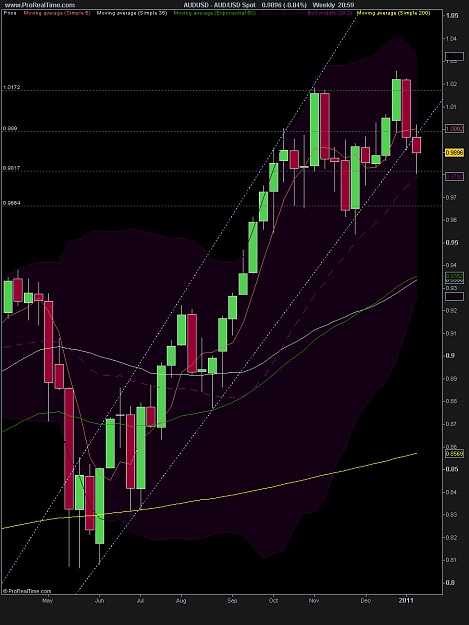
My weekly and monthly also have that area marked on them, I'll post them in a followup so as not to crowd this post.
Here's my weekly and monthly.. those lines have been on there for weeks and in some cases months. I do adjust them every now and then based on the close of the weekly candles. But they show further confluence -- we know that price isn't likely to get past a big key area on its first attempt, etc.
If anyone reading this is new to the thread, all of this might seem like a lot of work for a few trades but it's really not all that bad. You can do your main homework on the weekends and then adjust your levels a little bit during the week based on the close of your 1H/4H candles if need be.