I am building a price action system on 1m charts. I trade EUR/USD. GBP/USD, USD/CHF, USD/JPY. I would like to share ideas with others to hlep build this system.
GBP/USD,
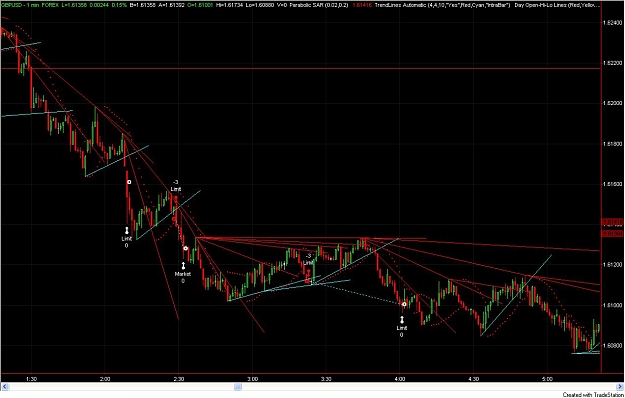
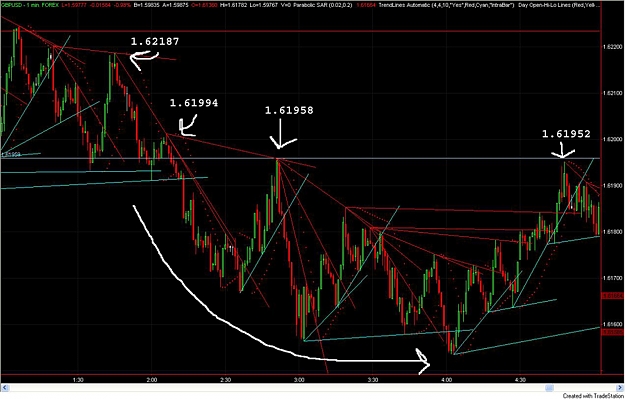
I hope the attached chart is readable. I am posting this because I want to see what others think or if others trade this way. This works well for me. .
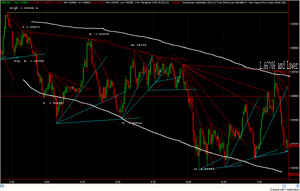
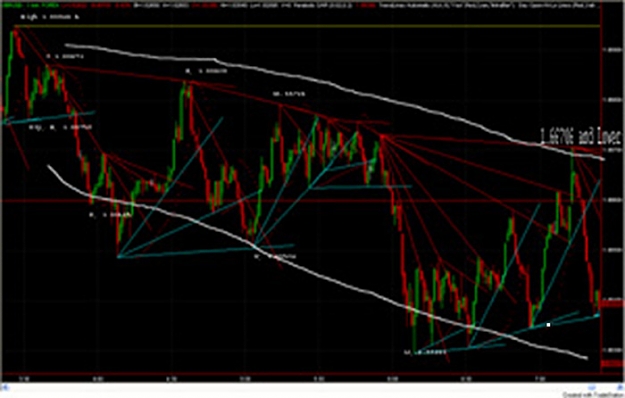
I have noticed in the GBP/USD that after a new high it will form this pattern. Like in this chart way back from 12/2/2009. The GBP forms a high, A 1.66948, dips B 1.66759, rises C 1.66871, dips D 1.66485, rises E 1.66839, dips F 1.66504, rises G 1.66724 and then falls usually to a new low, H 1.66291. When the move from C - D is larger than 20 pips, this move results in a new low. When the move from C-D is 30 pips or more, the total move is over 100pips with a retraction that is lower than G.
The way I trade this is I enter at E, or a little lower. Since the move from C-D is so big, I know the move will result in a new low. After G happens and if there are attempts to reach that price, I will add to my postion.
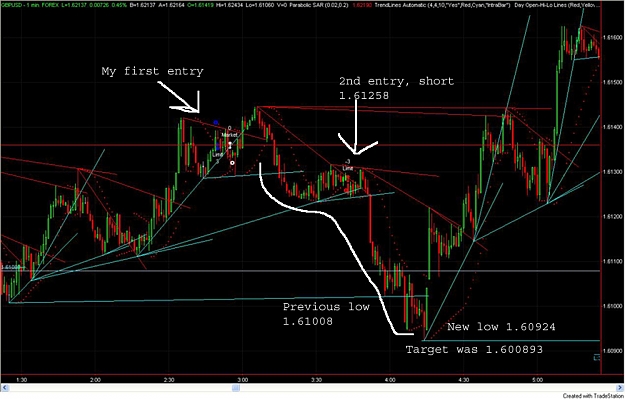
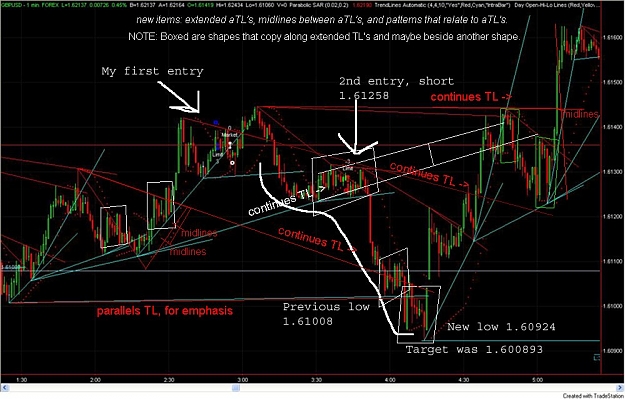
In this chart the difference between A and G is 65 pips. Now, what I have noticed after looking at about 3 months of data, is that because the move from C-D is so large, this move isn't done. That 1.66706 candle with a big wick would be a good chance to enter wait for a move 40 pips below the H level.
The hard part of this is waiting for E to develop. You could jump in at C but this move may not develop. Or price could just fall almost straight down.
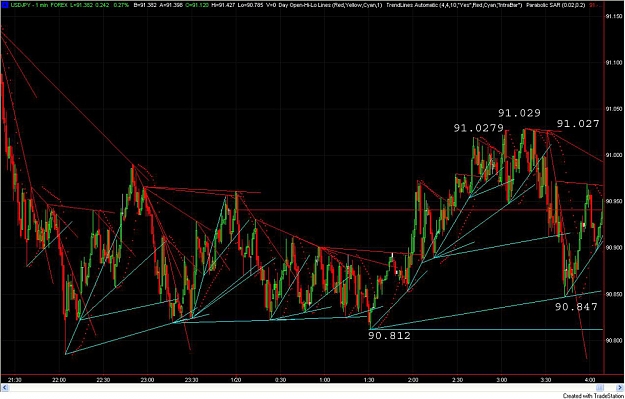
I hope this was helpful and I hope someone can help me with this pattern. I have noticed it in the EUR/USD and USD/CHF pair. I have seen it in the USD/JPY also but it looks a little different.
I will post more. There are more types of moves I have noticed. The more work I put into analyzing my charts, the more my confidence will grow when trading. The more I talk, write, about my charts the more I analyze them. See how it works.
GBP/USD,
I hope the attached chart is readable. I am posting this because I want to see what others think or if others trade this way. This works well for me. .
I have noticed in the GBP/USD that after a new high it will form this pattern. Like in this chart way back from 12/2/2009. The GBP forms a high, A 1.66948, dips B 1.66759, rises C 1.66871, dips D 1.66485, rises E 1.66839, dips F 1.66504, rises G 1.66724 and then falls usually to a new low, H 1.66291. When the move from C - D is larger than 20 pips, this move results in a new low. When the move from C-D is 30 pips or more, the total move is over 100pips with a retraction that is lower than G.
The way I trade this is I enter at E, or a little lower. Since the move from C-D is so big, I know the move will result in a new low. After G happens and if there are attempts to reach that price, I will add to my postion.
In this chart the difference between A and G is 65 pips. Now, what I have noticed after looking at about 3 months of data, is that because the move from C-D is so large, this move isn't done. That 1.66706 candle with a big wick would be a good chance to enter wait for a move 40 pips below the H level.
The hard part of this is waiting for E to develop. You could jump in at C but this move may not develop. Or price could just fall almost straight down.
I hope this was helpful and I hope someone can help me with this pattern. I have noticed it in the EUR/USD and USD/CHF pair. I have seen it in the USD/JPY also but it looks a little different.
I will post more. There are more types of moves I have noticed. The more work I put into analyzing my charts, the more my confidence will grow when trading. The more I talk, write, about my charts the more I analyze them. See how it works.
Attached File(s)