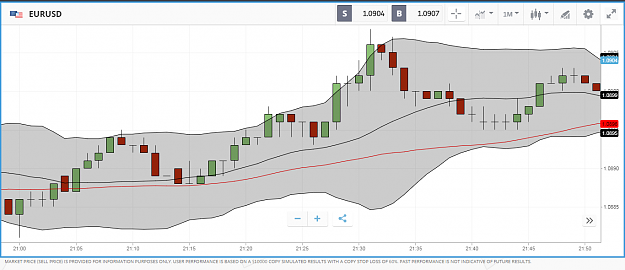
I am using Bollinger Bands and SMA Studies for the etoro Charts in 1 Min. & 5 Min. Time Frames..
But, what I want is to see is that I get the same Figures of the 2 Mentioned Studies (for the 1 & 5 minutes) in chosen time frames.
Example; For Instance, Choosing a Candlestick for time 21:00, then for a 1 min. chart, I should be able to see the same figures of Studies (B. Bands and SMAs) as for a 5min. chart with the same time unit (i.e. 21:00) (i.e. irrespective of the Size of the Candlesticks)..
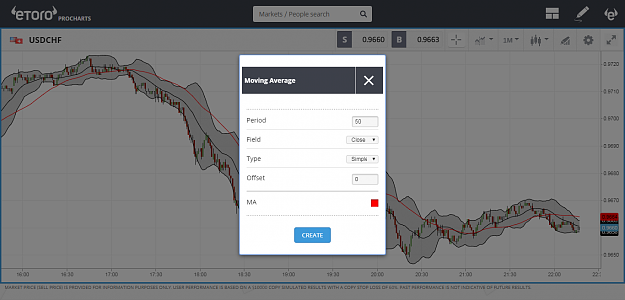
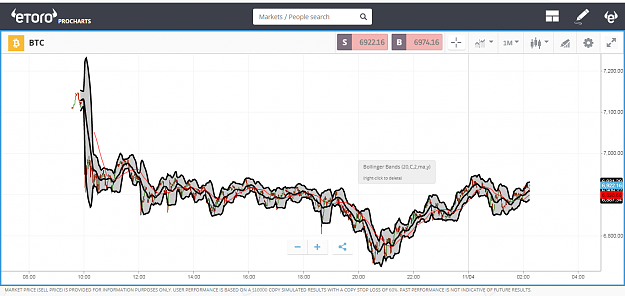
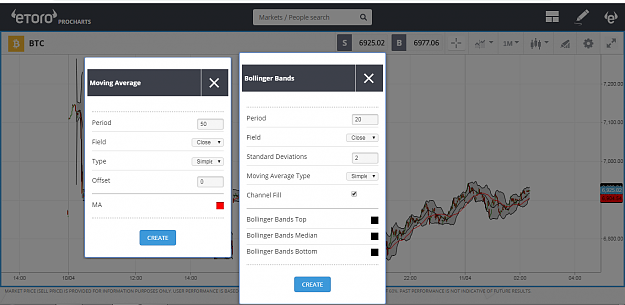
To explain more , I am attaching the Screen shots I did for the 1 min. & 5 min. Charts at different times..
Along with the study tools details I used for it.
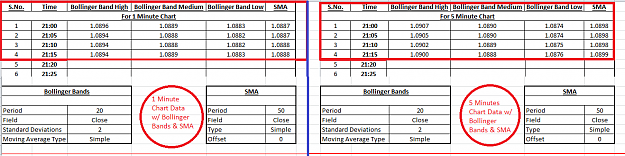
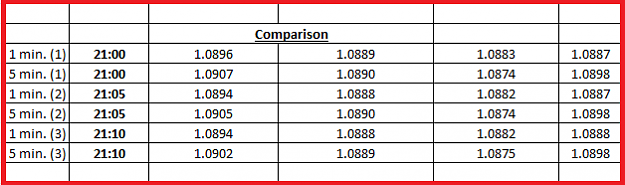
The Comparisons I did for the 1 min. and 5 min. Charts w.r.t. the figures of studies...
Can you please,see to it guys and let me know what changes I should make to the settings of the Study tools which can help me to bring the same figures results for both the time frames ?...
But, what I want is to see is that I get the same Figures of the 2 Mentioned Studies (for the 1 & 5 minutes) in chosen time frames.
Example; For Instance, Choosing a Candlestick for time 21:00, then for a 1 min. chart, I should be able to see the same figures of Studies (B. Bands and SMAs) as for a 5min. chart with the same time unit (i.e. 21:00) (i.e. irrespective of the Size of the Candlesticks)..
To explain more , I am attaching the Screen shots I did for the 1 min. & 5 min. Charts at different times..
Along with the study tools details I used for it.
Attached Image (click to enlarge)
Attached Image (click to enlarge)
Attached Image (click to enlarge)
The Comparisons I did for the 1 min. and 5 min. Charts w.r.t. the figures of studies...
Attached File(s)
Can you please,see to it guys and let me know what changes I should make to the settings of the Study tools which can help me to bring the same figures results for both the time frames ?...