• Home
  • Forums
  • Trades
  • News
  • Calendar
  • Market
  • Brokers
  • Login
  • Join
  • User/Email: Password:
  • 12:45am
Menu
  • Forums
  • Trades
  • News
  • Calendar
  • Market
  • Brokers
  • Login
  • Join
  • 12:45am
Sister Sites
  • Metals Mine
  • Energy EXCH
  • Crypto Craft

Options

Bookmark Thread

First Page First Unread Last Page Last Post

Print Thread

Similar Threads

Profitunity (Chaos) Trading System by Bill Williams 1,616 replies

Another Trading Journal - Yuhu's Journal 16 replies

Trading in the Zone advanced indicator (Trading Chaos by Bill Williams) 12 replies

Trading Chaos? 27 replies

Based on Trading Chaos 2nd . My journal. 20 replies

  • Trading Journals
  • /
  • Reply to Thread
  • Subscribe
  • 33
Attachments: Trading Chaos Journal
Exit Attachments

Trading Chaos Journal

  • Post #1
  • Quote
  • First Post: Dec 30, 2009 8:18am Dec 30, 2009 8:18am
  •  Tommy_C
  • | Joined Oct 2006 | Status: Member | 140 Posts
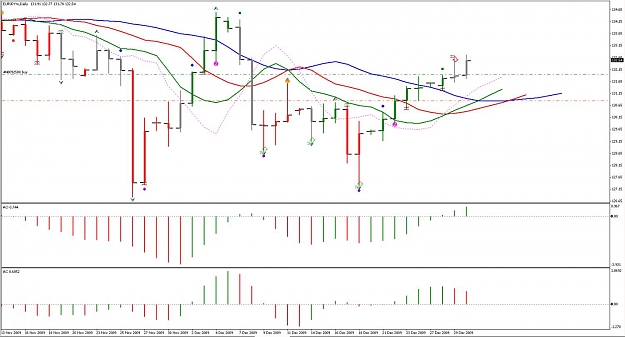
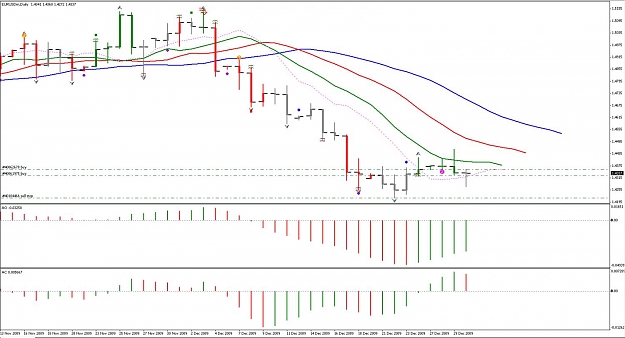
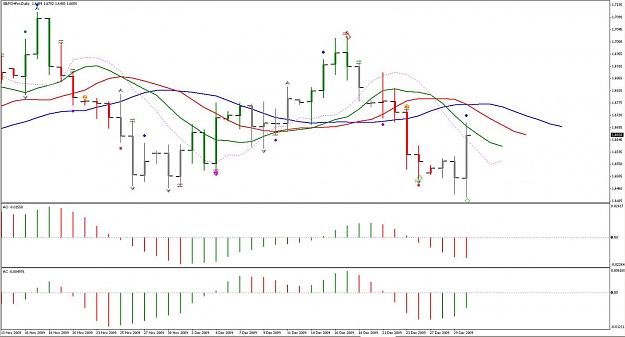
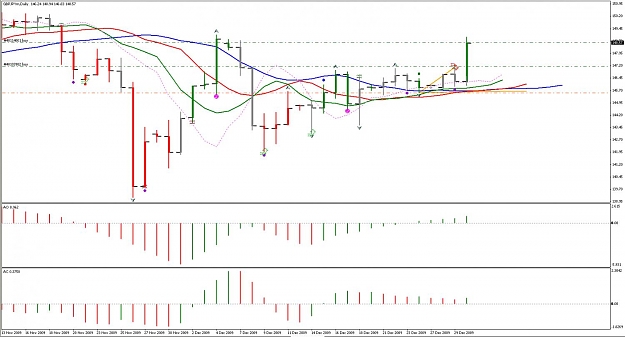
I have started my own blog (http://chaostrading.blogspot.com/) to record my trades using Bill Williams' trading methodology. I thought, however, that I would also copy those blog posts and put them in a journal here, so other could discuss them if they wish.

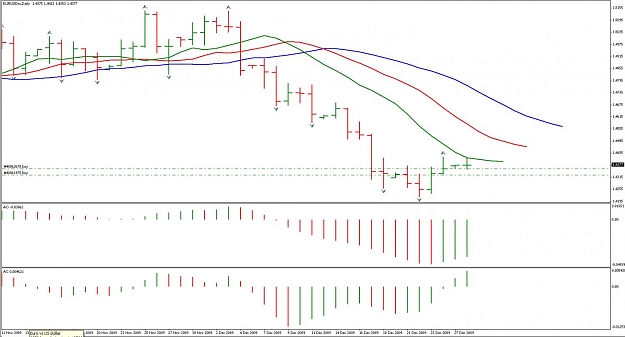
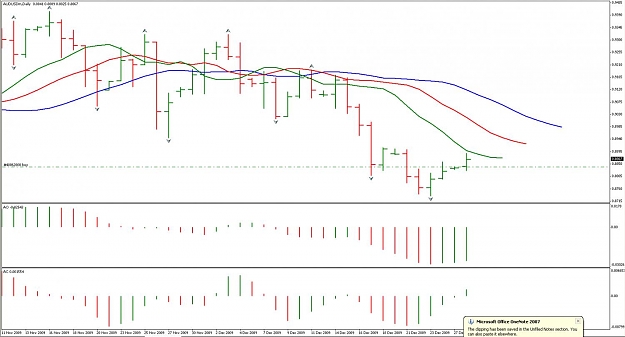
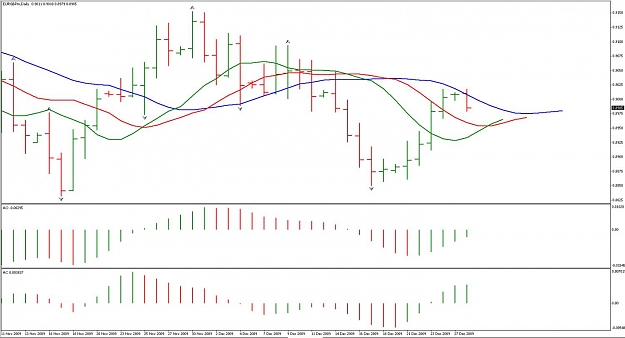
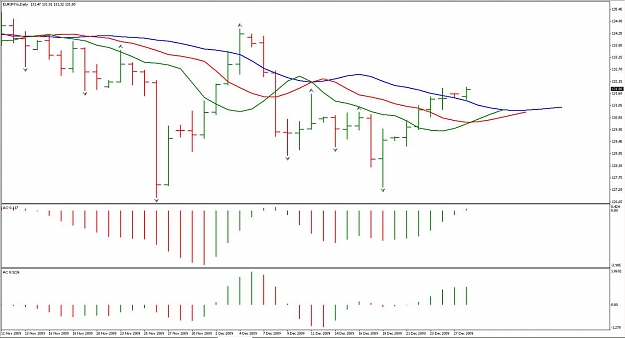
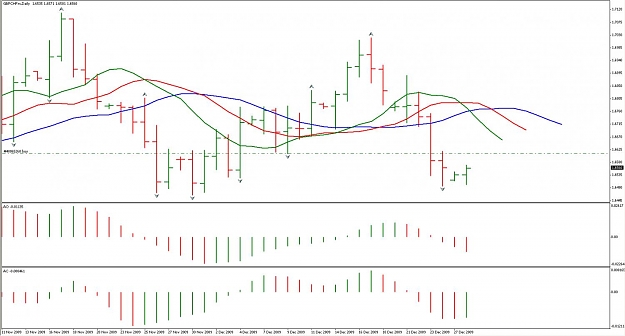
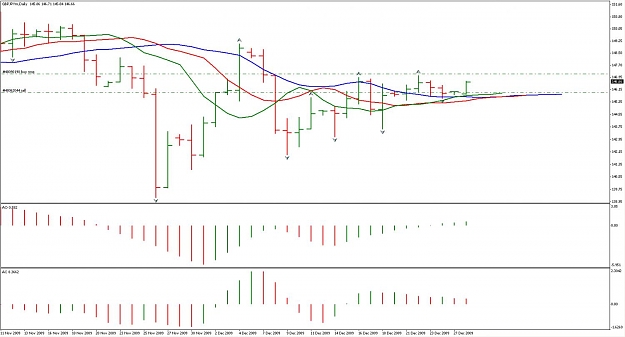
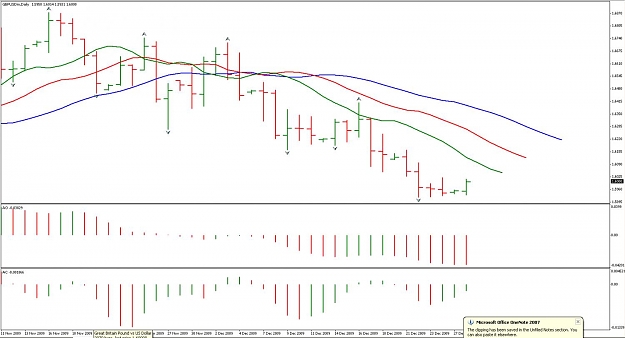
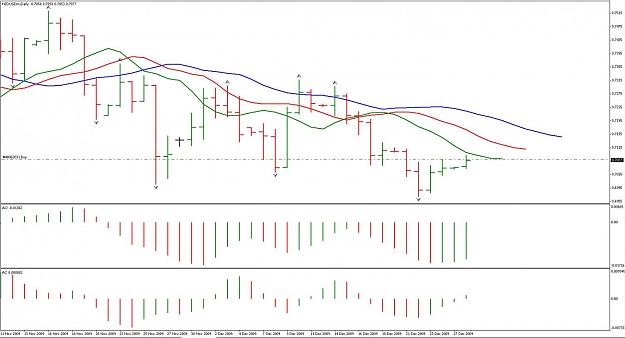
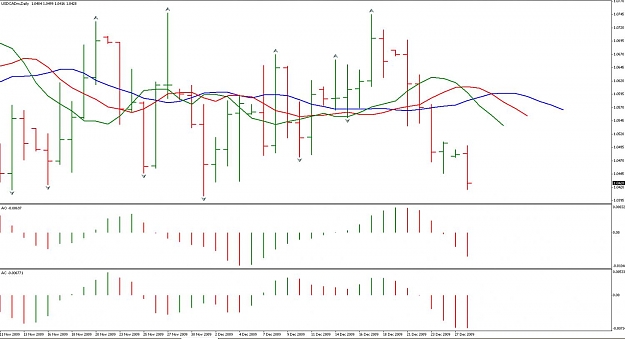
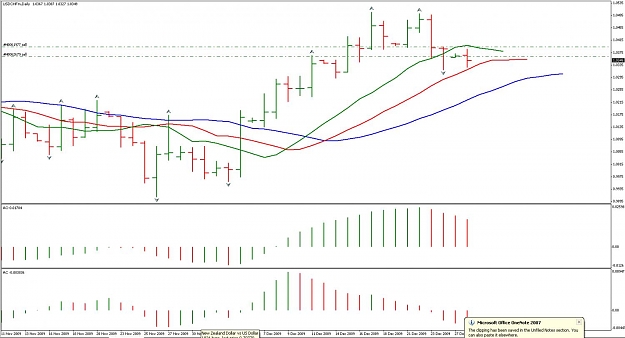
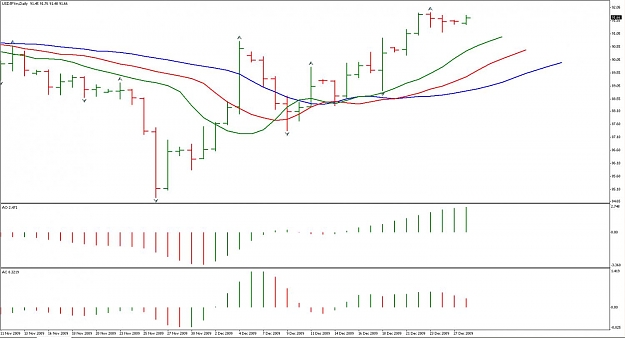
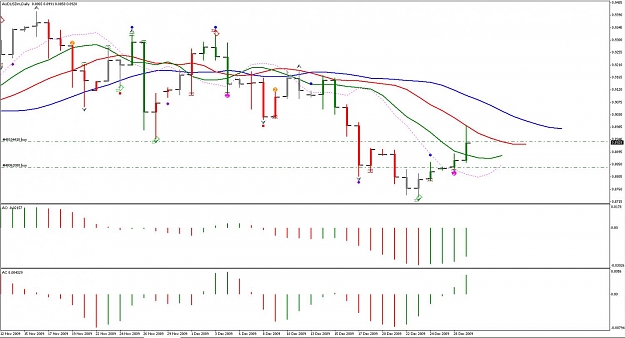
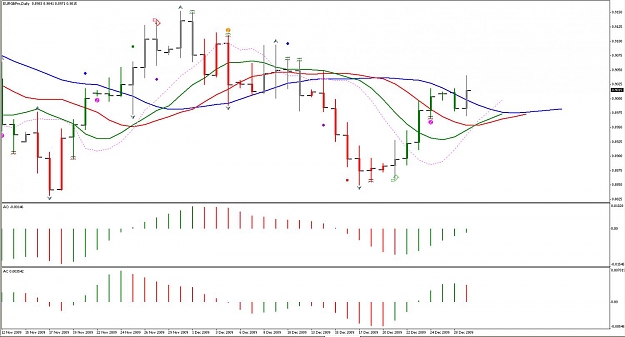
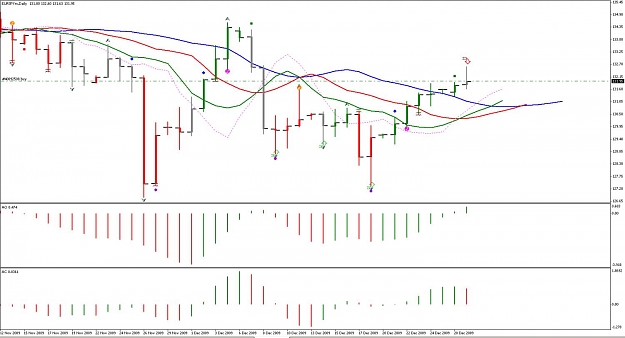
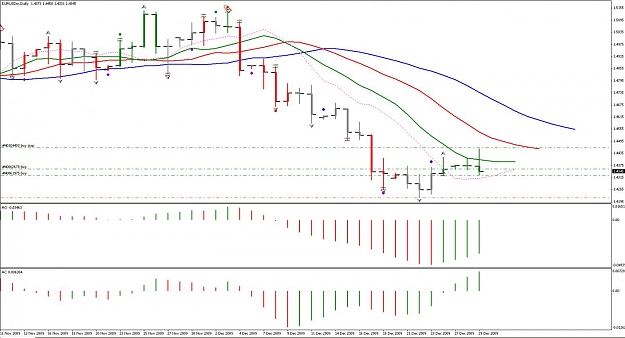
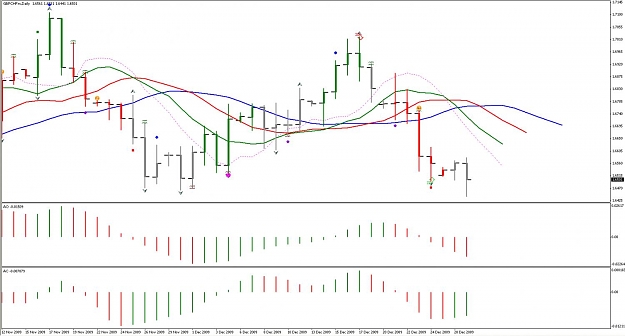
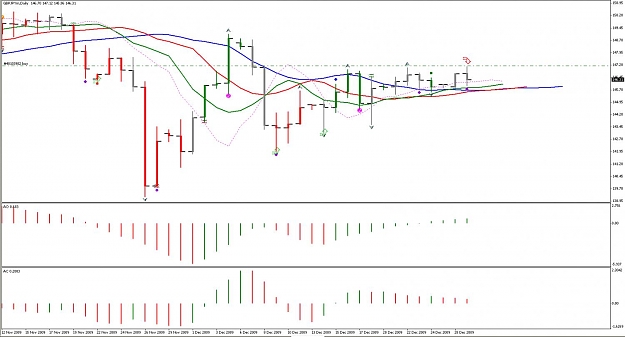
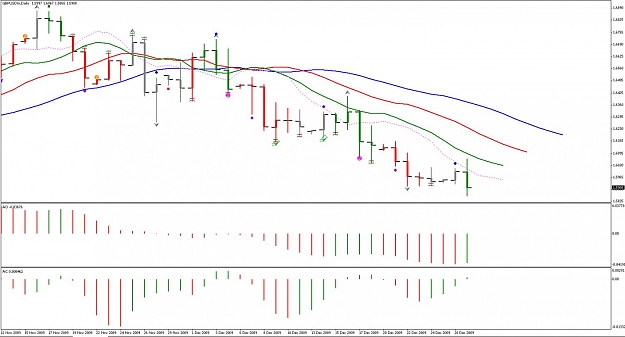
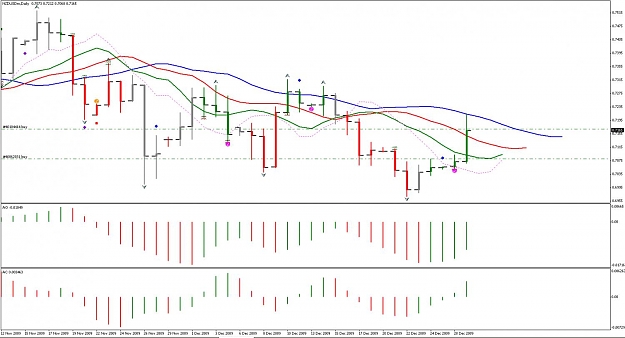
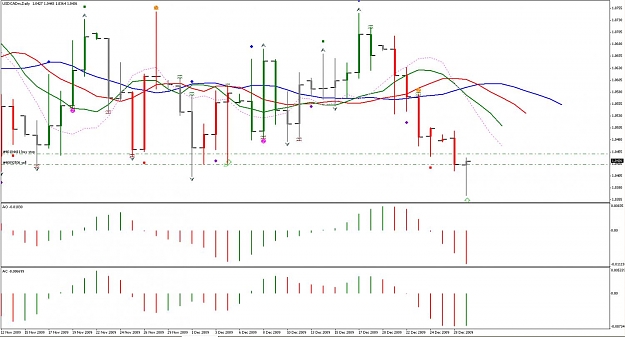
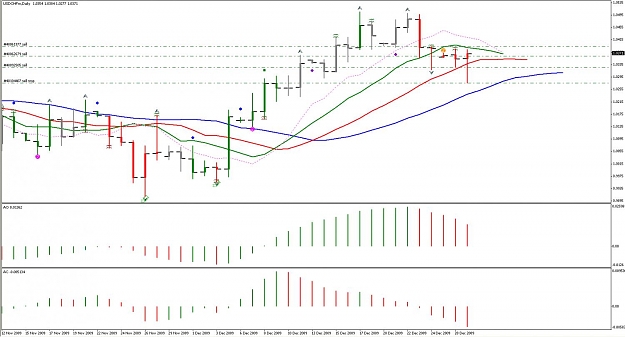
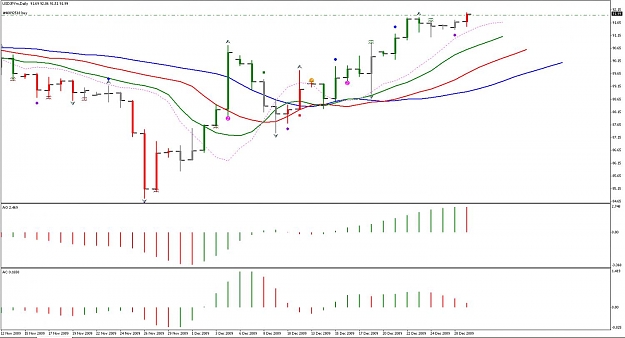
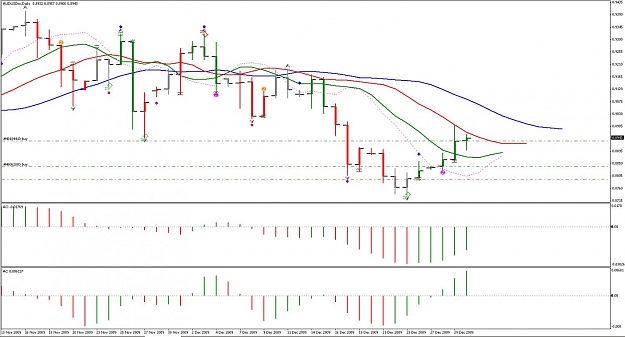
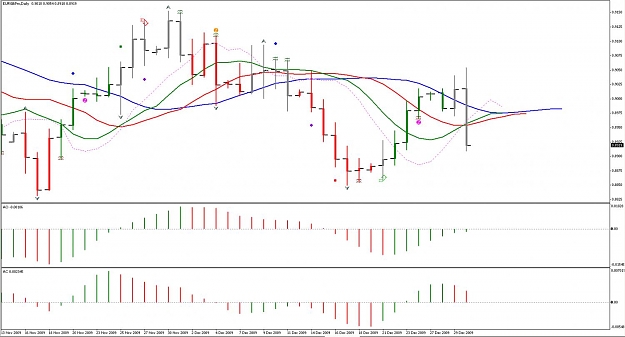
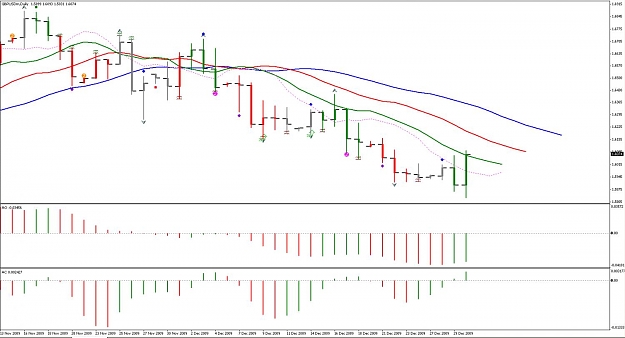
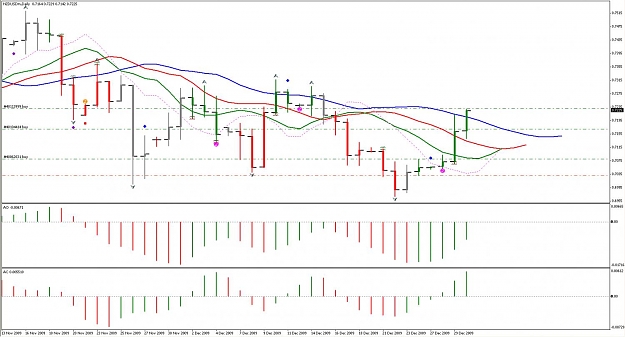
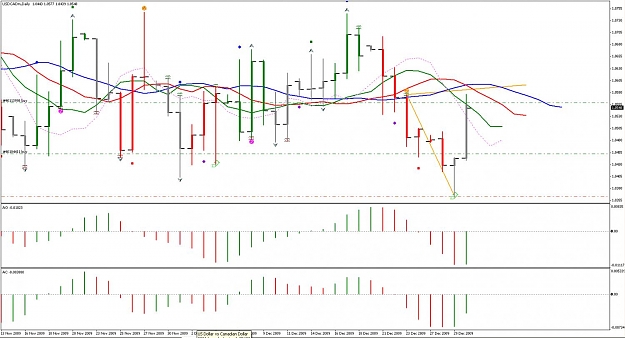
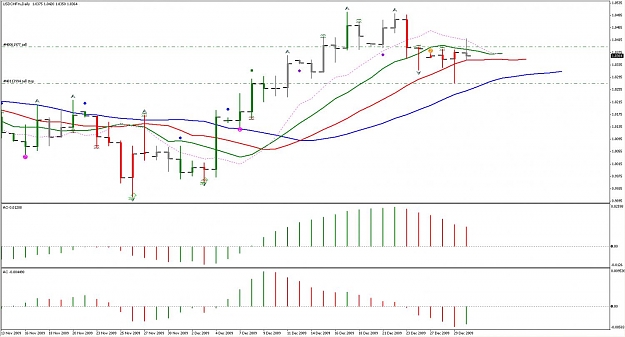
Each day I will post the daily charts for the eleven different pairs that I follow. They will only be the daily charts, as I have a full-time job and a new baby, so I don't have the time (or the sleep) to spare for intra-day trading.

I have already posted two days worth of charts on my blog, so my first posts here will be going back in time. Just bear with me. Tomorrow I will be caught up.

Enjoy. And feel free to comment.
  • Post #2
  • Quote
  • Dec 30, 2009 8:38am Dec 30, 2009 8:38am
  •  Tommy_C
  • | Joined Oct 2006 | Status: Member | 140 Posts
Apparently, I can't place images in the body of the post, so I will have to put them as attachments. Moreover, I can only put seven attachments per post. That's inconvenient, to say the least.

Sorry....

Here are the charts and the commentary from 28 December 2009:

EUR/USD: The two open buy orders are hold-overs from last week when I was trading the H4 chart. If those orders weren't already active, I wouldn't be taking any trades off the D1 yet. What I see is price below alligator, with no divergent bar yet. We really don't have three green AO bars, yet, as the Sunday bar needs to be tossed out. So, off the D1 chart, I would wait until the end of tomorrow to see if we get another green AO. At that point, I would place an order above the high of the closing bar.


AUS/USD: The active order is from the previous week, from the H4 chart. It still corresponds nicely with the D1 chart, however, as it seems to be at the right level for the divergent bar at the bottom of the chart. As far as any new orders, there aren't any to be placed. Again, there really aren't three green AO bars. So, I'll wait to the close of tomorrow's bar. If there is another green AO, I'll put a buy stop above the high of the closing bar.


EUR/GBP: I don't see any trades on this chart right now. There were three green AO bars, but the high of that candle has already been surpassed, so I will wait for a new signal.


EUR/JPY: On this chart there was a bullish divergent bar, followed by 3 green AO bars, followed by an up fractal. As the uptrend seems to be well in place, and the AO & AC were green (giving a Zone trade signal), I placed a buy order above the top of today's bar.


GBP/CHF: The open order is a hold-over from last week. It is negative right now. There aren't any signals on the D1. Actually, I could place an order for a BL sell, below the low two bars previous. Even though it is marked as a fractal, it really isn't b/c Sunday's bar doesn't count. If it was a true fractal, then I would definitely have a sell order below the low


GBP/JPY: This market has gone to sleep. There is a current sell order active. That is a hold-over from last week. I have placed a buy order above the current up fractal. I'm just waiting for this market to break out one way or the other. When it does, it should be rather spectacular, as the GBP/JPY usually moves a lot, and it has been quiet for far too long.


GBP/USD: There aren't really any available signals. There's no divergent bar for a long trade. Actually, I could place a sell order below the current down fractal. For some reason, I don't feel like doing that. That's actually a bad decision, for I need to follow every signal from the system. Picking and choosing is a sure way to losing.

Attached Images (click to enlarge)
Click to Enlarge

Name: EURUSD 28DEC.jpg
Size: 97 KB Click to Enlarge

Name: AUDUSD 28DEC.jpg
Size: 100 KB Click to Enlarge

Name: EURGBP 28DEC.jpg
Size: 98 KB Click to Enlarge

Name: EURJPY 28DEC.jpg
Size: 97 KB
Click to Enlarge

Name: GBPCHF 28DEC.jpg
Size: 98 KB Click to Enlarge

Name: GBPJPY 28DEC.jpg
Size: 95 KB Click to Enlarge

Name: GBPUSD 28DEC.jpg
Size: 100 KB
 
 
  • Post #3
  • Quote
  • Dec 30, 2009 8:41am Dec 30, 2009 8:41am
  •  Tommy_C
  • | Joined Oct 2006 | Status: Member | 140 Posts
Here are the others from 28DEC2009.

NZD/USD: The current order is a hold-over from last week. There aren't any current signals on the D1. Actually, again, I should have a pending sell order below the recent down fractal. And, there is a BL sell signal, below the low of the bar third from the right. I just don't feel like placing those orders, for I intuitively feel that the market is going to go up.


USD/CAD: Clearly, this pair is in a downtrend. I don't have a position in, right now, but there is a current signal. AO & AC are both red, and price closed down. I placed a sell order at the end of the day. Actually, the down move is a little extended, as this is, already, the fourth red zone bar in a row (we discount Sunday's bar). So, I would expect that this downtrend might be ending soon. We'll see.


USD/CHF: The two active orders are hold-overs from last week, trading the H4. On the D1 chart, the currently closing bar is the third red AO, and I placed a sell order below the low of the closing bar.


USD/JPY: The market is in an uptrend, although there aren't any signals on the D1. That really isn't a fractal at the top of the chart, because it is only a fractal because of Sunday's bar. There aren't any zone trades. There aren't any individual AO or AC signals.


Attached Images (click to enlarge)
Click to Enlarge

Name: NZDUSD 28DEC.jpg
Size: 103 KB Click to Enlarge

Name: USDCAD 28DEC.jpg
Size: 97 KB Click to Enlarge

Name: USDCHF 28DEC.jpg
Size: 107 KB Click to Enlarge

Name: USDJPY 28DEC.jpg
Size: 92 KB
 
 
  • Post #4
  • Quote
  • Dec 30, 2009 8:47am Dec 30, 2009 8:47am
  •  Tommy_C
  • | Joined Oct 2006 | Status: Member | 140 Posts

AUD/USD: Discounting the Sunday bar, there were three green AO bars. Moreover, both AO & AC were green and price closed up for the day, giving a Zone Trade signal. I placed an order to buy at the close of the candle. (With Zone Trades, you don't have to put a pending order above the high, you just go enter the market at the end of the day.)


EUR/GBP: I missed the W2 signal from Friday, and there was no new signal today, so I am doing nothing in this market. At this point, I would be looking for a pullback in price so I could enter either on a fractal or a balance line trade.

EUR/JPY: There's no new signal on this pair. Yesterday's bar actually formed a divergent bar (i.e. made a new high and closed in the lower half), but I don't see any angulation. I tend to stay away from the divergent bars unless the angulation is so clear. Here, prices are barely out of the Alligator, so I'm not going to do anything.

EUR/USD: No new signals on this pair today. The indicator has colored the bar green, as AO and AC were both green, but it isn't a Zone Trade, for price actually closed down for the day. As you can see from the chart, I initially put a buy stop above the high of the bar. When I remembered that wasn't proper, given the down close, I removed that pending order.

GBPCHF: No new signals for this pair. The chart shows a down fractal three bars previous. As I think I said yesterday, IBFX's inclusion of a Sunday bar is what made that a fractal. If there were no Sunday bar, the fractal wouldn't be there. That's why I didn't put an order to sell below it. I could have, actually placed a sell order for a Balance Line trade beneath it. That would have been proper. As it is, I will just have to wait for a new signal to be generated.

GBP/JPY: This market continues to go nowhere. It looks like my buy order above the most recent up fractal was triggered. I think that, after I took this screenshot, I placed a sell order below the more recent sell fractal. Still and all, just waiting for this market to start moving again.

GBP/USD: No new signal on this pair. I guess I should have placed a sell order below the current down fractal. I could have also placed a sell order for a BL trade beneath the fourth bar from the right. I didn't do that, however. I will need to correct that tendency. The only way this will work is to mechanically trade every signal given. As it is, I will have to wait for a new signal to develop.

Attached Images (click to enlarge)
Click to Enlarge

Name: AUDUSD 29DEC.jpg
Size: 109 KB Click to Enlarge

Name: EURGBP 29DEC.jpg
Size: 99 KB Click to Enlarge

Name: EURJPY 29DEC.jpg
Size: 103 KB Click to Enlarge

Name: EURUSD 29DEC.jpg
Size: 111 KB
Click to Enlarge

Name: GBPCHF 29DEC.jpg
Size: 97 KB Click to Enlarge

Name: GBPJPY 29DEC.jpg
Size: 96 KB Click to Enlarge

Name: GBPUSD 29DEC.jpg
Size: 97 KB
 
 
  • Post #5
  • Quote
  • Dec 30, 2009 8:49am Dec 30, 2009 8:49am
  •  Tommy_C
  • | Joined Oct 2006 | Status: Member | 140 Posts
Here are the last charts from last night:

NZD/USD: There was a new signal today. With the strong up move, AO & AC were green and price closed up. That's a perfect Zone Trade signal, so I went long at the close of the day.


USD/CAD: Yesterday was a classic bullish divergent bar, signaling that the down move is over, temporarily. You can see the sharp angle down of the prices. You can clearly see how it is steeply moving away from the Alligator. Moreover, the bar was long and closed close to the very top. This is a hammer formation, or a pin bar, or a divergent bar. Whatever you want to call it, it is clearly screaming that price is getting ready to go up. I moved my stops in to right above the top of the bar. This will, actually, leave me with a small loss on both postions. It's my own fault, really, for I got into the trade too long ago. I will be looking to go long right above the top of this bar.


USD/CHF: No new signals on this pair. Even though the indicator colored the bar red, indicating that AO & AC were both red, price actually closed up for the day, so there wasn't a ZT. The thing that disturbs me is the candle formation, with the long lower wick, and the up close for the day. That would make me think price is going to reverse and go up. Price hadn't dropped very far, though, and AO and AC were both red meaning that price was going down and accelerating down. I'll have to be cautious. After I took this screen shot, I moved my stops in above the high of the past 3 candles. That's actually pretty close to the price, but I just wanted to make sure I wasn't caught in a dramatic up move.


USD/JPY: No new signal on this pair. My buy order above the most recent up fractal was hit. Other than that, I will wait for a new signal.

Attached Images (click to enlarge)
Click to Enlarge

Name: NZDUSD 29DEC.jpg
Size: 109 KB Click to Enlarge

Name: USDCAD 29DEC.jpg
Size: 109 KB Click to Enlarge

Name: USDCHF 29DEC.jpg
Size: 111 KB Click to Enlarge

Name: USDJPY 29DEC.jpg
Size: 100 KB
 
 
  • Post #6
  • Quote
  • Dec 31, 2009 9:17am Dec 31, 2009 9:17am
  •  Tommy_C
  • | Joined Oct 2006 | Status: Member | 140 Posts
Here are the first seven Daily charts from last night:

AUD/USD: Both AO & AC were green, and price closed up for the day, giving a Zone Trade signal. Also, you could say that, as the high of the day before was higher than yesterday's high, and we are trading from the long side, that there would be a Balance Line trade signal, too. The Balance Line signal calls for a pending order above the top of the previous day's bar. The Zone Trade signal would have us going long at the close of the current bar. This is where I decided to use a little discretion. I didn't like the shape of today's bar. Price did close up, but the high was lower than yesterday. It is a doji candle, indicating indecision. I decided to forgo the Zone Trade signal and instead go with the Balance Line signal. I placed an order to go long above the high of the previous day's bar.

EUR/GBP: Still no signal on this pair. Price put in a massive down day. AO & AC not in agreement. No fractal signals. No AO saucer sell signals, or AC above the zero sell signals. I will stand aside and wait for an actual signal.

EUR/JPY: No new signal on this pair. Price closed up, but AO & AC did not agree, so no ZT. No other AO or AC signals, nor was there any fractal signal.

EUR/USD: No new signals on this pair. Conceivably you could make the argument that the current bar is a divergent bar. It did make a new low, and price did close in the upper half of the bar. But I don't see it as a divergent bar because there is no angulation or separation from the Alligator. I am going to hang tight with my two longs from last week and wait for a more definite signal.

GBP/CHF: Price put in a massive move up, but there isn't really a new signal. It isn't a divergent bar, in my opinion, for it touches the Alligator. There aren't three green AO bars yet, nor is there a fractal signal. AC is signaling a buy, due to three green AC bars below the zero line, but that is just an add on signal, once we were already trading from the long side. As I still have no position in this currency, and price is still below the Alligator, I will wait for a better signal.

GBP/JPY: Price closed up. AO & AC were both green. Classic Zone Trade signal, so I went long at the close of the bar. I am hoping for a big move from the GBP/JPY, as price has done very little for the past several weeks.

GBP/USD: It looks like this is the start of a move up in price, but there isn't a signal yet. There is no divergent bar. There haven't been three green AO bars. Those would be the only two long signals I would consider taking while price is still below the Alligator. So I will wait to get three green AO bars, or some fractal signal, before going long.

Attached Images (click to enlarge)
Click to Enlarge

Name: AUDUSD 30DEC.jpg
Size: 112 KB Click to Enlarge

Name: EURGBP 30DEC.jpg
Size: 104 KB Click to Enlarge

Name: EURJPY 30DEC.jpg
Size: 112 KB Click to Enlarge

Name: EURUSD 30DEC.jpg
Size: 111 KB
Click to Enlarge

Name: GBPCHF 30DEC.jpg
Size: 105 KB Click to Enlarge

Name: GBPJPY 30DEC.jpg
Size: 109 KB Click to Enlarge

Name: GBPUSD 30DEC.jpg
Size: 107 KB
 
 
  • Post #7
  • Quote
  • Last Post: Dec 31, 2009 9:19am Dec 31, 2009 9:19am
  •  Tommy_C
  • | Joined Oct 2006 | Status: Member | 140 Posts
Here are the last four:

NZD/USD: Price closed up. AO & AC were both green, too, so that is a classic ZT signal. I went long at the close of the current bar. There will, however, be no more ZTs taken on this pair, and the stop will be trailed at the low of the previous candle, as there have been five green zone bars in a row. We should expect some kind of pullback soon.

USD/CAD: It appears that going long on the bullish divergent bar was the right call. Now that we are on the long side, AO & AC were green, price closed up, so I took the ZT signal and went long at the close of the current bar.

USD/CHF: There is a BL sell signal on this pair. As I am trading on the short side, and the low of the current bar is higher than the low of the previous bar, I placed a sell order below the low of the previous bar. I still think this pair is going to go down, indicating a stronger CHF, because all of the other USD pairs are indicating dollar weakness. Sadly, I think I moved my stops in too close yesterday. I got stopped out of several of my open positions. I still have an open short, purely by accident. I must have overlooked it when setting my stops on the other orders. If I had been paying more attention, I would have reset the stop on it, and it would be closed now, too. C'est la vie.

USD/JPY: There is an AO saucer buy signal on this pair, so I placed a buy order above the high of the closing bar. As you can see from the gray price bar, AO & AC do not agree, so there is no ZT signal. Nor is there a new fractal signal.

Attached Images (click to enlarge)
Click to Enlarge

Name: NZDUSD 30DEC.jpg
Size: 120 KB Click to Enlarge

Name: USDCAD 30DEC.jpg
Size: 123 KB Click to Enlarge

Name: USDCHF 30DEC.jpg
Size: 111 KB Click to Enlarge

Name: USDJPY 30DEC.jpg
Size: 111 KB
 
 
  • Trading Journals
  • /
  • Trading Chaos Journal
  • Reply to Thread
0 traders viewing now
Top of Page
Forex Factory Blog Updated: Alerting All Members
  • Facebook
  • Twitter
About FF
  • Mission
  • Products
  • User Guide
  • Media Kit
  • Blog
  • Contact
FF Products
  • Forums
  • Trades
  • Calendar
  • News
  • Market
  • Brokers
  • Trade Explorer
FF Website
  • Homepage
  • Search
  • Members
  • Report a Bug
Follow FF
  • Facebook
  • Twitter

FF Sister Sites:

  • Metals Mine
  • Energy EXCH
  • Crypto Craft

Forex Factory® is a brand of Fair Economy, Inc.

Terms of Service / ©2022