DislikedHi Custos & MktScape
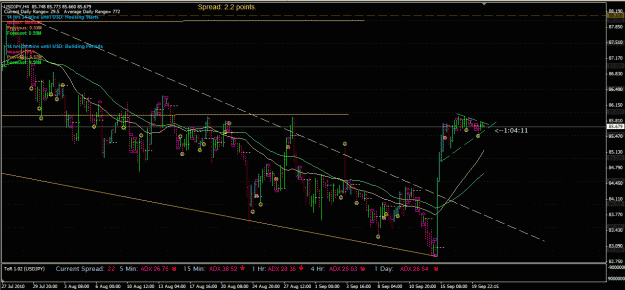
E-A is seen potentially going north based on PA?
A bull engulf candle shown at H4.
A pin bar with long wick at D.
CheersIgnored
One hint:
Dont start with focus on PA first ...always start with marking S/R pivot zones starting from highest time frame i.e. monthly and you can come down to Daily or H4
+
Draw TLs to determine higher TF trend direction and/or for channels , triangles / pennants
Our objective here is :
1- to develop a bias i.e if a pair is trending or moving sideway or just being choppy / erratic PA
2- Where the price is in the big picture ...is it at a major support or resistance level or about to reach there?
Therefore if the bigger trend is down and Price appraoching a resistance level then it dosent matter if the current price bar is bullish because we dont want to buy into a resistance or sell into a support.
In fact ...as far as i know the market makers create these large bullish bars to entice to novice trader to buy or sell where they shouldnt.
And last but not the least dont forget to zoom out max on each TF to mark your levels .... this will give you a better understanding than simply looking at last few day or week of data .... as it appears on your chart.
Cheers