well, I am right now trading my newly tested strategy. Thus I am not watching high probability levels at this point (need to focus in on this strat first and then either combine it or drop one of the strats).
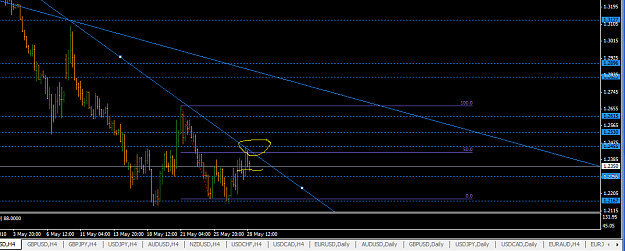
Anyways, my charts look something like this now. Very messy for the untrained eye. All S/R levels marked up. So not sure if it's of any use for you guys if I post such messy charts...
Anyways, my charts look something like this now. Very messy for the untrained eye. All S/R levels marked up. So not sure if it's of any use for you guys if I post such messy charts...
DislikedI would use an indicator from time to time, one for price (MACD) and one for volume (Volume RSI). The way I use it is only to confirm divergences and nothing more .... as we know that indicator is essentially taking the price action into account.
As price and volume give a potent combination in analysis therefore i feel that if one can get a confirmation from these two unrelated data types then the probablity of anticipated price action is high. But my main course of analysis is of course, PA. In forex we have tick volume and we have to use comparitive...Ignored
Attached Image (click to enlarge)