I often used to find do my sorrow, that a good looking trade oportunity turned into a terrible one. Because while dabbling on the smaller timeframes (M5 up to M30) I did not realise that the pips variance was so LOW.
So I made a simple indicator to keep it visible.
http://docs.google.com/View?id=dddphpjg_17gf2zwmdg
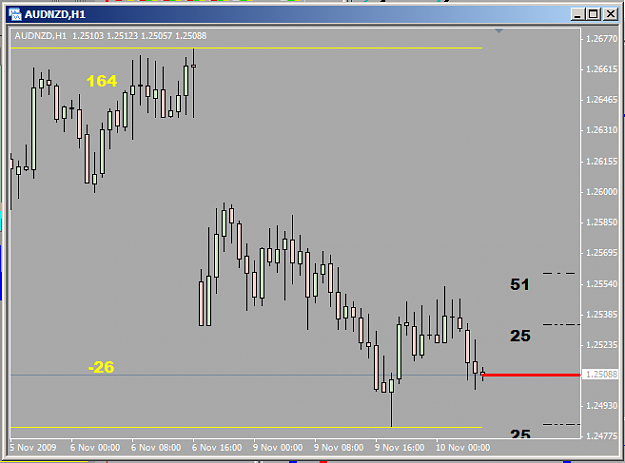
The yellow lines are the high and lows visible on the chart, and the numbers are how many pips from Bid to High and Low respectively.
If the Bid is in the lower half of the High/Low range, the Bid Line shows Red, if it is in the top half it shows Blue. If it is pushing new High's, it is Aqua, and if it is pushing new Low's it is Lime.
The Black Lines and numbers cover the range (the values change according to how big the range is)
It works in the MBT Mt4 platform as well as the 4 Digit MT4's.
Attatched Below are a pic of the indicator and the indicator as well.
ps. If ANYONE can show me an easier way of placing the text in the right positions, please feel free to share that info.
Blue Mental
So I made a simple indicator to keep it visible.
http://docs.google.com/View?id=dddphpjg_17gf2zwmdg
The yellow lines are the high and lows visible on the chart, and the numbers are how many pips from Bid to High and Low respectively.
If the Bid is in the lower half of the High/Low range, the Bid Line shows Red, if it is in the top half it shows Blue. If it is pushing new High's, it is Aqua, and if it is pushing new Low's it is Lime.
The Black Lines and numbers cover the range (the values change according to how big the range is)
It works in the MBT Mt4 platform as well as the 4 Digit MT4's.
Attatched Below are a pic of the indicator and the indicator as well.
ps. If ANYONE can show me an easier way of placing the text in the right positions, please feel free to share that info.
Blue Mental
Attached Image (click to enlarge)
Attached File(s)