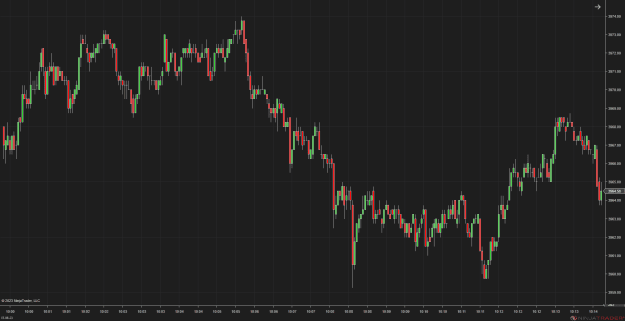
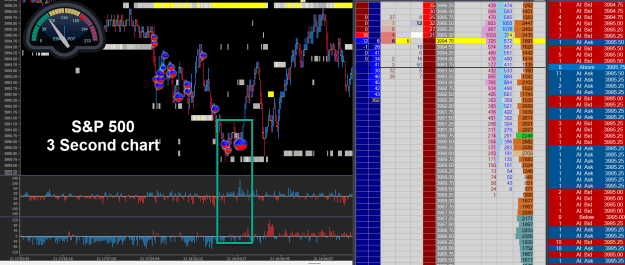
I use Oanda and they have a 5 second, 10 second and 30 second charts apart from other charts.
What is the use of 5 S, 10 S, 30 S charts? Is it possible to make money using these above time frame charts?
What is the use of 5 S, 10 S, 30 S charts? Is it possible to make money using these above time frame charts?