Hello,
I have an idea for a what I believe to be a very simple indicator. It will help me out immensely and I imagine others as well. If you can/would help, I would be much obliged!
When trading in any of the lower time-frames it becomes difficult to keep the chart in "perspective" because of the auto-scaling feature. I find the alternative, fixed scale, cumbersome. Furthermore, the zoomed in chart can be helpful, if I can keep it from catching me "off guard".
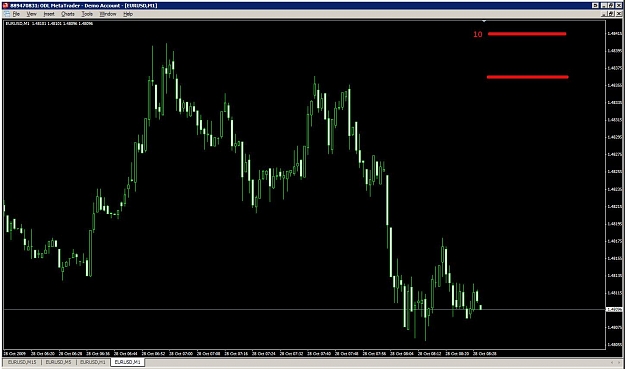
I think two horizontal lines that are x number of pips apart would be perfect. The lines would have to be a fixed width, i.e. not extend across the whole screen (would interfere with S&R, trend, fib and etc lines).
Ideally, this indicator would have the following features:
_user selectable location by corner and further tuning of x and y coordinates
_user definable "x" (number of pips between lines)
_a small text indication of what "x" is currently set to
_does NOT float with chart scrolling (stays fixed in corner as relates to window, not the chart)
_user selectable color
_user definable width
_user definable weight of lines (thickness)
I attached a picture of what I envision this looking like (I screwed up the pip count, should say "5").
Thank you in advance for any help you can provide!
Regards,
Derek
I have an idea for a what I believe to be a very simple indicator. It will help me out immensely and I imagine others as well. If you can/would help, I would be much obliged!
When trading in any of the lower time-frames it becomes difficult to keep the chart in "perspective" because of the auto-scaling feature. I find the alternative, fixed scale, cumbersome. Furthermore, the zoomed in chart can be helpful, if I can keep it from catching me "off guard".
I think two horizontal lines that are x number of pips apart would be perfect. The lines would have to be a fixed width, i.e. not extend across the whole screen (would interfere with S&R, trend, fib and etc lines).
Ideally, this indicator would have the following features:
_user selectable location by corner and further tuning of x and y coordinates
_user definable "x" (number of pips between lines)
_a small text indication of what "x" is currently set to
_does NOT float with chart scrolling (stays fixed in corner as relates to window, not the chart)
_user selectable color
_user definable width
_user definable weight of lines (thickness)
I attached a picture of what I envision this looking like (I screwed up the pip count, should say "5").
Thank you in advance for any help you can provide!
Regards,
Derek
Attached Image (click to enlarge)