• Home
  • Forums
  • Trades
  • News
  • Calendar
  • Market
  • Brokers
  • Login
  • Join
  • 1:21pm
Menu
  • Forums
  • Trades
  • News
  • Calendar
  • Market
  • Brokers
  • Login
  • Join
  • 1:21pm
Sister Sites
  • Metals Mine
  • Energy EXCH
  • Crypto Craft

Options

Bookmark Thread

First Page First Unread Last Page Last Post

Print Thread

Similar Threads

Twitch Journal - Live Journal 4 replies

Another Trading Journal - Yuhu's Journal 16 replies

My Personal journal up 18% in 2 months going to start a journal 8 replies

Newbie Factory Journal 12 replies

Trading Diary/Journal 5 replies

  • Trading Journals
  • /
  • Reply to Thread
  • Subscribe
  • 28
Attachments: JJ's Journal
Exit Attachments
Tags: JJ's Journal
Cancel

JJ's Journal

  • Last Post
  •  
  • Page 1 2
  • Page 1 2
  •  
  • Post #1
  • Quote
  • First Post: Jul 13, 2009 10:18am Jul 13, 2009 10:18am
  •  Jimmy Jones
  • | Joined Jul 2008 | Status: Member | 457 Posts
My place to work out my issues and become profitable again...

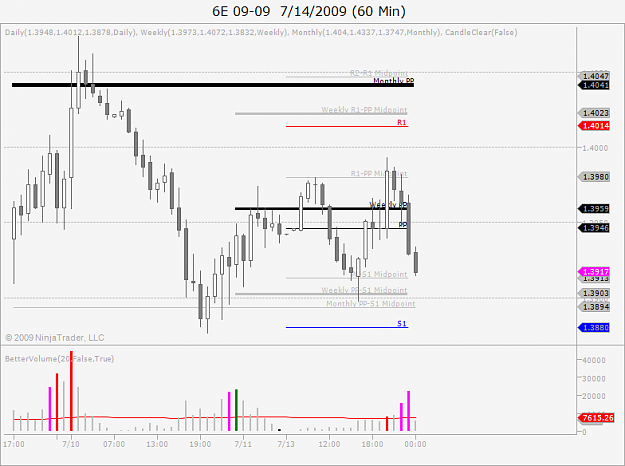
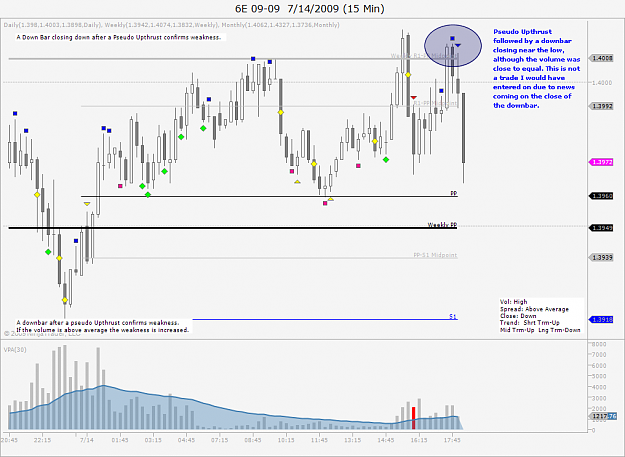
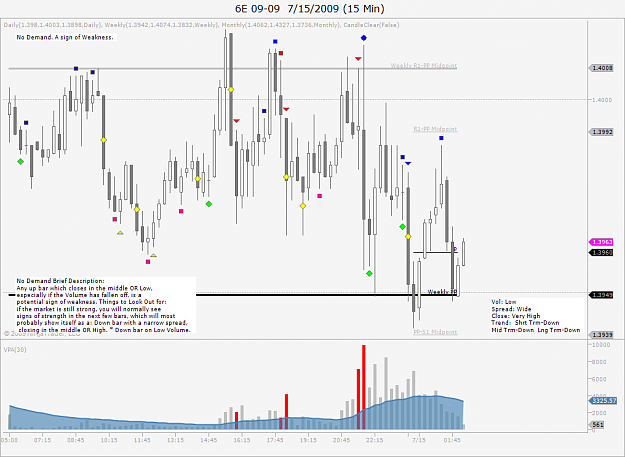
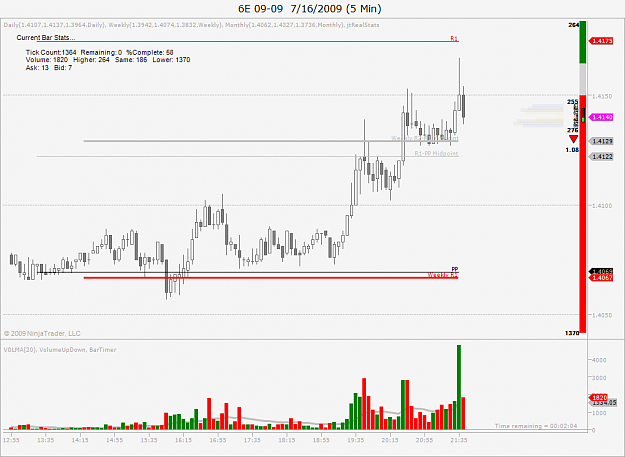
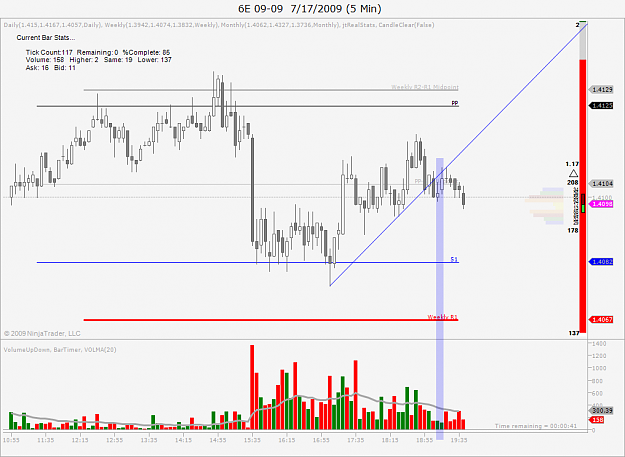
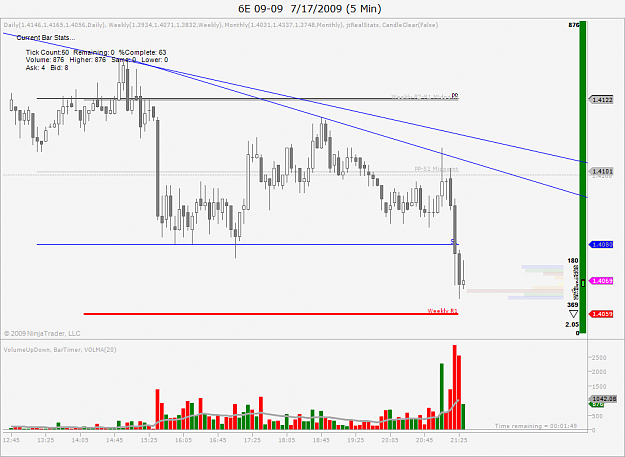
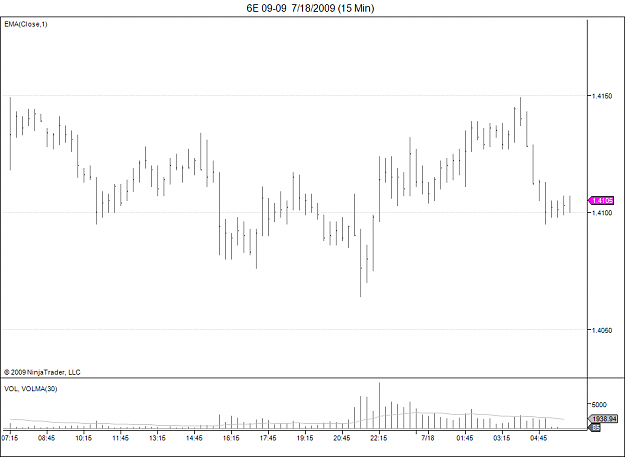
Spent the day setting up Ninja Trader charts, found a better volume indicator and some pivots that have mid points. The pivots require the Close, High and Low to be entered manually but that's not a major issue. I'm using an IBFX demo to get that information for Daily, Weekly and Monthly bars.

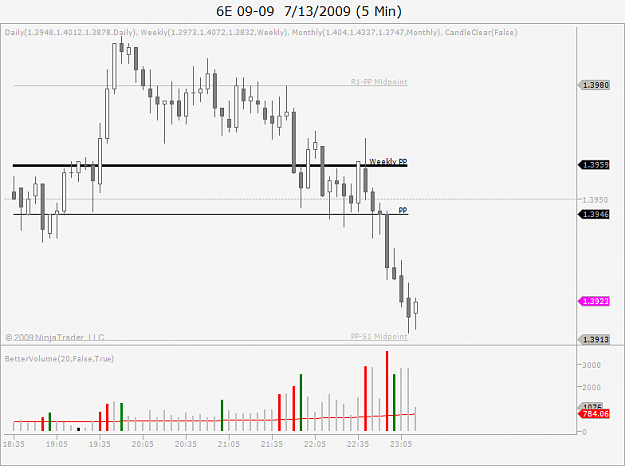
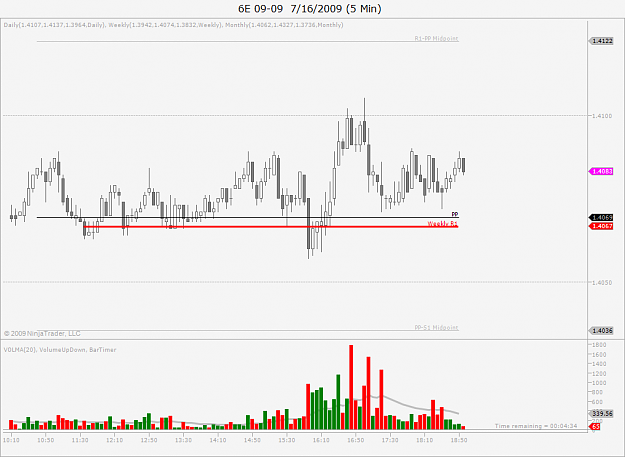
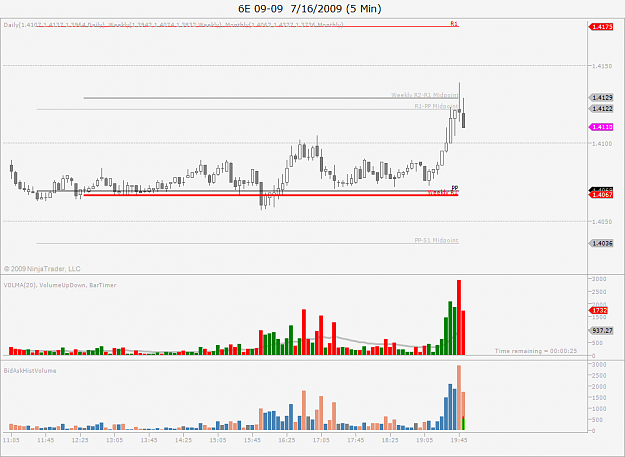
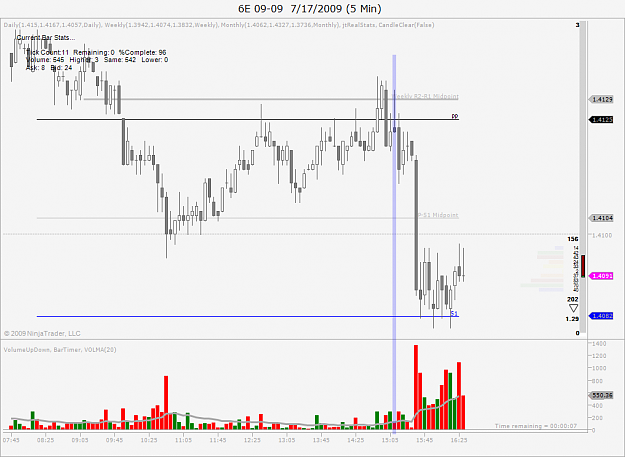
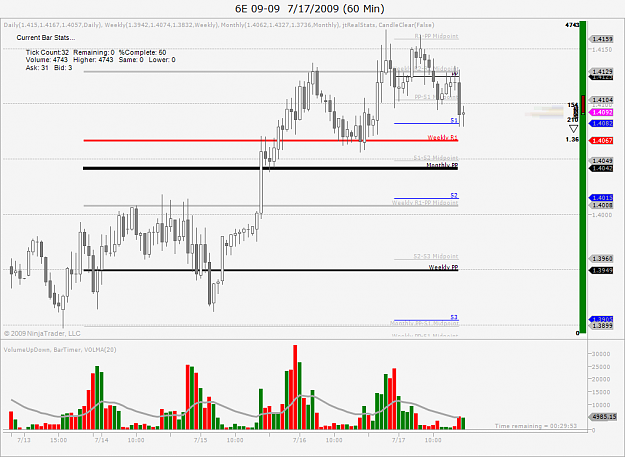
The 60m chart clearly shows price reacting to these zones of pivot confluence. The 5m chart is even more clear. Right now I am watching EU 5m to see a pullback to the daily pivot with a clear rejection, if that were to happen I would go short were I trading live today.

The volume is from EU futures contract, using a zen fire 30 day demo to get the feed. I'm not 100% percent clear on VSA yet but I plan on digging a little deeper over the next few weeks.
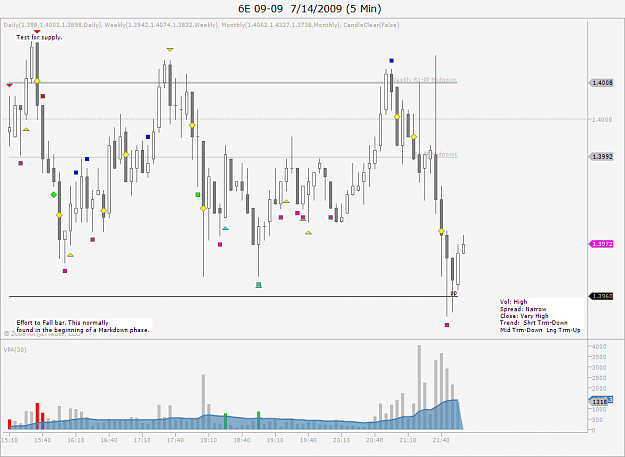
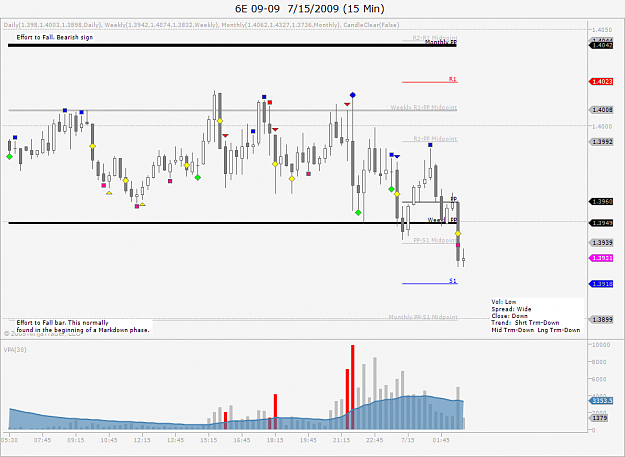
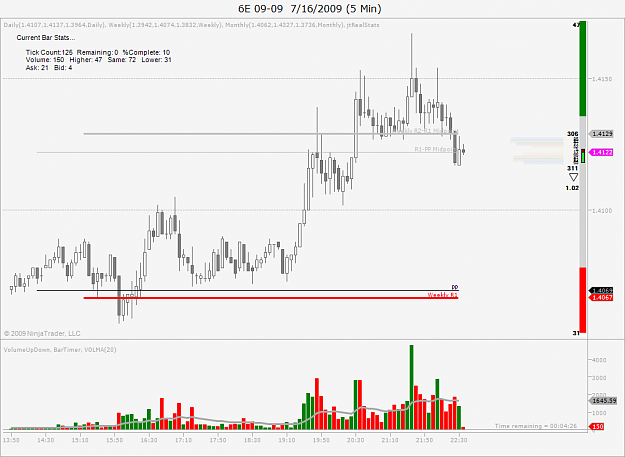
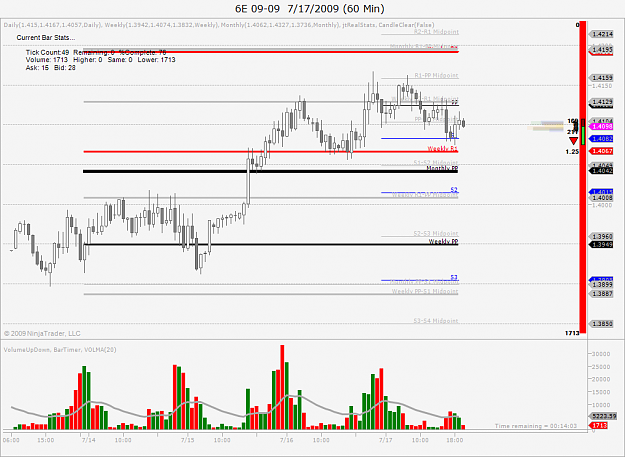
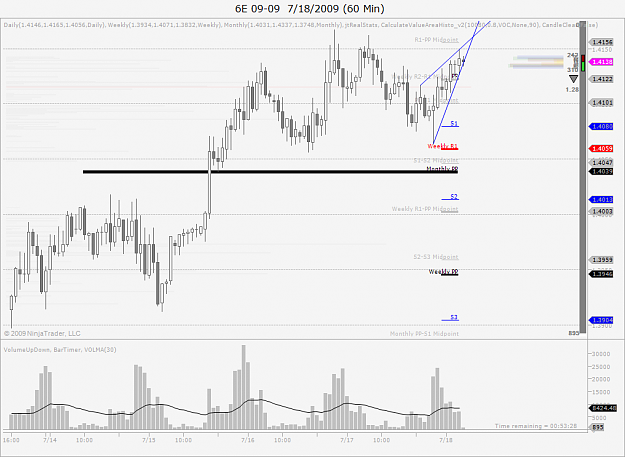
Attached Image(s) (click to enlarge)
Click to Enlarge

Name: 6E 09-09  7_14_2009 (60 Min).png
Size: 36 KB
Click to Enlarge

Name: 6E 09-09  7_13_2009 (5 Min).png
Size: 30 KB
  • Post #2
  • Quote
  • Jul 13, 2009 11:35am Jul 13, 2009 11:35am
  •  Jimmy Jones
  • | Joined Jul 2008 | Status: Member | 457 Posts
I have read about smart money in the stock exchanges gapping up over or under resistance, I had never seen it happen in a cash forex feed, but I just noticed a gap up on a 1m futures chart up over the weekly pivot, while none of my live cash forex accounts show the gap. Interesting, it could just be a feed error in the futures data, don't know.
Attached Image (click to enlarge)
Click to Enlarge

Name: 6E 09-09  7_14_2009 (1 Min).png
Size: 34 KB
 
 
  • Post #3
  • Quote
  • Jul 14, 2009 2:46am Jul 14, 2009 2:46am
  •  Jimmy Jones
  • | Joined Jul 2008 | Status: Member | 457 Posts
EU 15m chart. Daily Pivots are based on futures high/low/close with a day ending time of 7AM Tokyo Standard Time (which I believe works out to be 16:00 AM Central Standard Time, the closing of the CME electronic trading day of futures).

In my study of VSA so far, I think a test followed by an up bar closing near the high confirms strength. We had a test and strength confirmation a few bars earlier but it was not off of any support, however this one happened right off the Daily Pivot. Without VSA this would have been an appealing long to me, with VSA it looked like a great setup to take.
Attached Image (click to enlarge)
Click to Enlarge

Name: 6E 09-09  7_14_2009 (15 Min).png
Size: 138 KB
 
 
  • Post #4
  • Quote
  • Jul 14, 2009 5:09am Jul 14, 2009 5:09am
  •  Jimmy Jones
  • | Joined Jul 2008 | Status: Member | 457 Posts
EU 15m chart. A pseudo Upthrust Bar followed by a Down Bar closing near the lows, but it was on equal volume (actually I just notice the volume was not equal, is was lower than average volume on the down bar), I need to read a bit and see if the equal volume negates the setup.

An interesting aside, I have my ninja trader futures feed set to update the chart based on orders coming in (ticks, is that the correct term?), as opposed to every half second (time based). Watching the NT futures feed next to my FX Pro MT4 feed was pretty cool right before the EU news releases. The NT feed was very violent, while the FX Pro feed had a lot of movement but it was smoothed out, not showing the actually volatility of the order flow...
Attached Image (click to enlarge)
Click to Enlarge

Name: 6E 09-09  7_14_2009 (15 Min).png
Size: 136 KB
 
 
  • Post #5
  • Quote
  • Jul 14, 2009 8:53am Jul 14, 2009 8:53am
  •  Jimmy Jones
  • | Joined Jul 2008 | Status: Member | 457 Posts
15m EU, a down bar with a higher high closing lower, following an up thrust bar, indicates possible reversal coming. Interesting to note this bar had two signals given, a Possible Reversal bar and Upthrust Bar. Not a trade I would take, it happened during news and is running right into daily pivot.

What's interesting though is the rising volume while price is falling, perhaps possible divergence? Also, I wonder, is this consolidation zone we are in accumulation or distribution?
Attached Image (click to enlarge)
Click to Enlarge

Name: 6E 09-09  7_14_2009 (15 Min).png
Size: 133 KB
 
 
  • Post #6
  • Quote
  • Jul 14, 2009 8:57am Jul 14, 2009 8:57am
  •  Jimmy Jones
  • | Joined Jul 2008 | Status: Member | 457 Posts
Another note on the EU 5m chart, notice all the tests for supply followed by up bars closing near the high, which are confirming strength is still present. I'm still a little unclear on the whole VSA idea, but it seems like maybe this is a distribution zone before price drops. This action is happening around the Daily Fib 38.2% level, this last push down put us back below...
Attached Image(s) (click to enlarge)
Click to Enlarge

Name: 6E 09-09  7_14_2009 (5 Min).png
Size: 55 KB
Click to Enlarge

Name: test.gif
Size: 26 KB
 
 
  • Post #7
  • Quote
  • Edited 1:10pm Jul 14, 2009 12:56pm | Edited 1:10pm
  •  Jimmy Jones
  • | Joined Jul 2008 | Status: Member | 457 Posts
Short EU
Entry: 1.3964
Stop: 1.3984
Target: None, will be watching VSA and trailing stop above pivots.

Reason: 15m chart had a Pseudo Upthrust bar up to the Daily R1 Mid Pivot. All day long we have been stuck in this range, each time we get to the top we get either Pseudo Upthrusts or the previous time a Possible Reversal. I entered with the plan of moving stop to BE once the Daily Pivot was reached.

Emotions: I have to say this was my first live trade since my meltdown last week. I liked the trade but I was still a bit nervous when I put on the order, I hesitated a bit as can be seen by the place I got in (should have been in over 10 pips sooner).

Status: Stop moved to BE, if it cannot hold below the daily pivot then it's not a trade I want to be in, I will be fine with getting stopped out on this one at BE.

CLOSED: Stopped out @ BE

Thoughts: Well, as I watched price just run up and barely get to my stop and then turn around and run back down I was tempted to short again, but I held myself in check. This is what hesitation will do, had I pulled the trigger when I wanted to, instead of second guessing myself for a few seconds, I would have been in a much better position to catch a break lower. Looks like the Daily Pivot might hold price below it. On to the next one.
Attached Image(s) (click to enlarge)
Click to Enlarge

Name: 6E 09-09  7_15_2009 (15 Min).png
Size: 130 KB
Click to Enlarge

Name: 6E 09-09  7_15_2009 (15 Min)exit.png
Size: 63 KB
 
 
  • Post #8
  • Quote
  • Jul 14, 2009 1:36pm Jul 14, 2009 1:36pm
  •  Jimmy Jones
  • | Joined Jul 2008 | Status: Member | 457 Posts
Price has pushed down through the Daily Pivot, retested and failed, and then a big push down through the Weekly Pivot / 3950 psych confluence area. If I was in the correct mindset I would stay at it and look for a retest and rejection of that 3950 confluence level, but right now I'm irritated that my hesitation cost me a chance to be in a good risk free trade up over 50 pips.

When I am in this mindset I am prone to doing stupid things, so I'm done for the day.
Attached Image (click to enlarge)
Click to Enlarge

Name: 6E 09-09  7_15_2009 (15 Min)2.png
Size: 55 KB
 
 
  • Post #9
  • Quote
  • Jul 16, 2009 5:18am Jul 16, 2009 5:18am
  •  Jimmy Jones
  • | Joined Jul 2008 | Status: Member | 457 Posts
Wanted to post a 5m chart with some observations, for me to remember when I am looking back at my posts in the journal.

1 - EU 5m chart, price bounced of the confluence of daily pivot and weekly R! several times before a high volume spike broke below.

2. The move down was matched with a move back up with pretty much equal volume, back to the 4100 handle.

3. We then see three large volume spikes to move the price back down to the daily Pivot. Bullish volume is characterized when price is moving down and volume is falling off.

4. We get a bullish bounce off the daily pivot, however this time the volume is much lower then on the previous move up (low volume means no professional interest I think?)

So what happens next? What can I gather from this volume information? The first really high volume downbar is coming on the rejection of the 4100 level. The very first huge selling volume bar is followed by a up bar two bars later with lower volume, but it closes near the high. Does this mean no demand, or no buying pressure from professionals to move price back over the 4100 handle?

The second really high volume down bar is again followed by a low spread low volume up bar, which again would indicate no buying pressure, or no demand.

The third really high volume down bar is followed two bars later by another low volume up bar, but this time the volume is just slightly higher than the previous bar, so does this negate it's classification as a possible no demand bar?

The push back up is on very low volume, indicating that the professionals are not moving the price up, the weak player is.

Note: These questions are for myself to ponder, I am no VSA expert yet so those of you who are please don't jump on me if I am getting something wrong! Working my way through the Master the Markets book a 2nd trime trying to understand the material on an intimate level
Attached Image (click to enlarge)
Click to Enlarge

Name: 6E 09-09  7_16_2009 (5 Min).png
Size: 102 KB
 
 
  • Post #10
  • Quote
  • Jul 16, 2009 5:52am Jul 16, 2009 5:52am
  •  Jimmy Jones
  • | Joined Jul 2008 | Status: Member | 457 Posts
Now we having rising prices on falling volume, which is considered bearish divergence I believe.
Attached Image (click to enlarge)
Click to Enlarge

Name: 6E 09-09  7_16_2009 (5 Min)2.png
Size: 42 KB
 
 
  • Post #11
  • Quote
  • Jul 16, 2009 6:56am Jul 16, 2009 6:56am
  •  Jimmy Jones
  • | Joined Jul 2008 | Status: Member | 457 Posts
So now we have the highest volume of the day on up bars, and then we have a big volume rejection type bar that tried to move up through Weekly and Daily mid pivot confluence and got rejected, again on the highest volume of the day so far. What kind of conclusions could I make from this information?

So rising prices on rising volume is considered bullish volume. Maybe we see a move back down to the 4100 handle on low volume, then maybe a test to see if any selling pressure is still around (supply). If we get a low volume test bar, then we maybe see another high volume move up to break through the mid pivot confluence? If we get a high volume test that means there is still supply that needs to be soaked up before selling pressure disappears and a markup can begin?
Attached Image (click to enlarge)
Click to Enlarge

Name: 6E 09-09  7_16_2009 (5 Min)3.png
Size: 43 KB
 
 
  • Post #12
  • Quote
  • Jul 16, 2009 8:40am Jul 16, 2009 8:40am
  •  Jimmy Jones
  • | Joined Jul 2008 | Status: Member | 457 Posts
Ultra high up bar volume with a wide spread bar. Is this professional money liquidating into the highs, trapping people into bad long positions taken on the basis of a possible triangle breakout on the daily?
Attached Image (click to enlarge)
Click to Enlarge

Name: 6E 09-09  7_16_2009 (5 Min)4.png
Size: 48 KB
 
 
  • Post #13
  • Quote
  • Jul 16, 2009 9:33am Jul 16, 2009 9:33am
  •  Jimmy Jones
  • | Joined Jul 2008 | Status: Member | 457 Posts
It looks like the extremely high volume wide spread up bar closing near the lows might have been smart traders liquidating into the highs before the markdown phase begins. We now see a push through the mid pivot confluence on slightly higher volume, but it does not really stand out to me...

I'm still reading the book again, I feel like I am going to have to read it many times. The high volume up bar I talked about in lat posted seemed kind of obvious that it was a possible head fake breakout, but the following action is not real clear to me. Although it seems like the last close might be a possible no supply bar, somewhat small spread up bar closing near the middle with volume less than the previous 2 bars...
Attached Image (click to enlarge)
Click to Enlarge

Name: 6E 09-09  7_16_2009 (5 Min)4.png
Size: 50 KB
 
 
  • Post #14
  • Quote
  • Jul 16, 2009 10:50am Jul 16, 2009 10:50am
  •  Jimmy Jones
  • | Joined Jul 2008 | Status: Member | 457 Posts
I think the volume picture is pretty clear on this 5m chart. Before we broke through the daily triangle earlier, the volume has been higher on up moves and lower on retraces. Then we got a huge upthrust that I believe was a fake out to sucker late longs who did not want to miss a chance on a long breakout.

Then on the proceeding push down through the weekly mid pivot and subsequent retest, the volume was very close to the same but the results versus effort appeared to be won out by the short move. Then high volume down bars almost matching the volume from the upthrust move to push down through the mid pivot confluence.

In my limited knowledge I think perhaps we start seeing higher volume down moves with more results on the effort, with low volume retraces, perhaps all the way back down to the bottom of the triangle on the daily.

Of course I could very well be wrong, just writing what I think and trying to learn from it...
Attached Image (click to enlarge)
Click to Enlarge

Name: 6E 09-09  7_16_2009 (5 Min)4.png
Size: 51 KB
 
 
  • Post #15
  • Quote
  • Edited 5:48am Jul 17, 2009 3:39am | Edited 5:48am
  •  Jimmy Jones
  • | Joined Jul 2008 | Status: Member | 457 Posts
Short EU
Entry: 1.4117
Stop: 1.4137
Target: None, will be watching VSA and trailing stop above pivots. Will move stop to BE if 4100 handle is breached and we get a close below.

Reason: 5m chart had an upthrust on high volume off the daily pivot, which indicated there was still buying pressure. Price then proceeded higher and eventually got back below the daily pivot. We had another upthrust, this time on lower volume, which indicated buying pressure was removed. I entered short based on that information.

Emotions: No emotions today, the trade makes sense and I did not hesitate.

Status: Stop has been moved to BE.

CLOSED: Stopped out at BE.

Thoughts: Looking at the 1hr chart, the last up move was on lower volume than the down move previous to it. Perhaps we see a further down move based on that information?

Additional Thoughts: I should have exited when price touched daily S1, and then started looking for another opportunity to get in. A tad bit irritated that I let a trade come back and stop me out, but it's a learning experience, and capital was protected, on to the next one.
Attached Image(s) (click to enlarge)
Click to Enlarge

Name: 6E 09-09  7_17_2009 (5 Min).png
Size: 117 KB
Click to Enlarge

Name: 6E 09-09  7_17_2009 (60 Min).png
Size: 60 KB
Click to Enlarge

Name: 6E 09-09  7_17_2009 (5 Min)exit.png
Size: 56 KB
 
 
  • Post #16
  • Quote
  • Jul 17, 2009 5:27am Jul 17, 2009 5:27am
  •  Jimmy Jones
  • | Joined Jul 2008 | Status: Member | 457 Posts
I have noticed something interesting in the last hour as I analyze the 5m chart using VSA while I am holding my short position. I find myself ignoring information that could be used to present the case for a move up, or trying to rationalize it to justify staying short. I'm not doing it on purpose, something that was happening on a subconscious level. Something to add to the list of things to work on.
 
 
  • Post #17
  • Quote
  • Edited 8:30am Jul 17, 2009 6:48am | Edited 8:30am
  •  Jimmy Jones
  • | Joined Jul 2008 | Status: Member | 457 Posts
Short EU
Entry: 1.4098
Stop: 1.4118
Target: Will move stop to BE with a close below S1, target to Weekly R1 as I suspect we wont just blow through that level.

Reason: A break down through a 5m uptrend line, followed by an up move on low volume to test the breakout, followed by down bars on higher volume. Also the last 2 hours move up was on lower volume than the move down on the hourly

Emotions: None really.

Status: Moving stop to BE

CLOSED: 1.4074, closed before news, no sense in giving up what I have in it during the news whipsaw.

Thoughts: None really, of course it would have been nice to get more than 24 odd pips, but it's better than a loss for sure.
Attached Image(s) (click to enlarge)
Click to Enlarge

Name: 6E 09-09  7_17_2009 (5 Min)2entry.png
Size: 130 KB
Click to Enlarge

Name: 6E 09-09  7_17_2009 (60 Min)2_1hr.png
Size: 60 KB
Click to Enlarge

Name: 6E 09-09  7_17_2009 (5 Min)2exit.png
Size: 56 KB
 
 
  • Post #18
  • Quote
  • Jul 17, 2009 3:09pm Jul 17, 2009 3:09pm
  •  Jimmy Jones
  • | Joined Jul 2008 | Status: Member | 457 Posts
Wanted to post this up so I don't forget to look next week. The last 5 hours or so of the EU move up has been on declining volume. What does this mean? Are we going to see a sell off early next week following this low volume up move? Is this simply declining volume as the week ends, or typical of any day as activity falls off?? We can look back and see these tee pee looking formations on the volume, maybe that's just how it looks over a day of trading, no matter what price is doing.

Another thing to look at, the volume 3 days back is really high, while the following two days is lower. Is there such a thing as divergence when looking at price swing high / low versus volume levels?

VSA is about effort vs result, as I have read and heard said many times. How can I look at a chart and see where the result was worth the effort, and where the result was not worth the effort? What happens when the result was not worth the effort? How can I figure out where the losers are by looking at this effort versus result idea?
Attached Image (click to enlarge)
Click to Enlarge

Name: 6E 09-09  7_18_2009 (60 Min).png
Size: 59 KB
 
 
  • Post #19
  • Quote
  • Jul 18, 2009 2:47pm Jul 18, 2009 2:47pm
  •  Jimmy Jones
  • | Joined Jul 2008 | Status: Member | 457 Posts
This next week I am going to be focusing on VSA in it's pure form (by pure I mean my interpretation of Master The Markets, after reading it for a 2nd time this weekend). Only HLC bars and volume. No pivots, no fancy level 2 tick volume indicator, no volume value zones indicator.

Bar by bar VSA, keeping in mind the background.
Attached Image (click to enlarge)
Click to Enlarge

Name: default.png
Size: 34 KB
 
 
  • Post #20
  • Quote
  • Jul 19, 2009 1:01pm Jul 19, 2009 1:01pm
  •  Jimmy Jones
  • | Joined Jul 2008 | Status: Member | 457 Posts
Just finished reading Master the Markets for the 2nd time, going to start up the third time and take some notes. The thing that stuck out the most this time was extreme volume on a move is a sign of danger. At the start of an uptrend after a correction, you would expect to see rising volume accompanied with rising prices. Many times however this volume can be very large. I wonder how one would define "extreme volume"?

Also, when looking at a low volume bar like a no demand / no supply, or a test bar, what is considered low? Are we only looking back at the previous bar or two for something to compare to?
 
 
  • Trading Journals
  • /
  • JJ's Journal
  • Reply to Thread
    • Page 1 2
    • Page 1 2
0 traders viewing now
  • More
Top of Page
  • Facebook
  • Twitter
About FF
  • Mission
  • Products
  • User Guide
  • Media Kit
  • Blog
  • Contact
FF Products
  • Forums
  • Trades
  • Calendar
  • News
  • Market
  • Brokers
  • Trade Explorer
FF Website
  • Homepage
  • Search
  • Members
  • Report a Bug
Follow FF
  • Facebook
  • Twitter

FF Sister Sites:

  • Metals Mine
  • Energy EXCH
  • Crypto Craft

Forex Factory® is a brand of Fair Economy, Inc.

Terms of Service / ©2023